Scotch-Irish vs Immigrants from West Indies Doctorate Degree
COMPARE
Scotch-Irish
Immigrants from West Indies
Doctorate Degree
Doctorate Degree Comparison
Scotch-Irish
Immigrants from West Indies
1.9%
DOCTORATE DEGREE
63.6/ 100
METRIC RATING
165th/ 347
METRIC RANK
1.5%
DOCTORATE DEGREE
0.9/ 100
METRIC RATING
258th/ 347
METRIC RANK
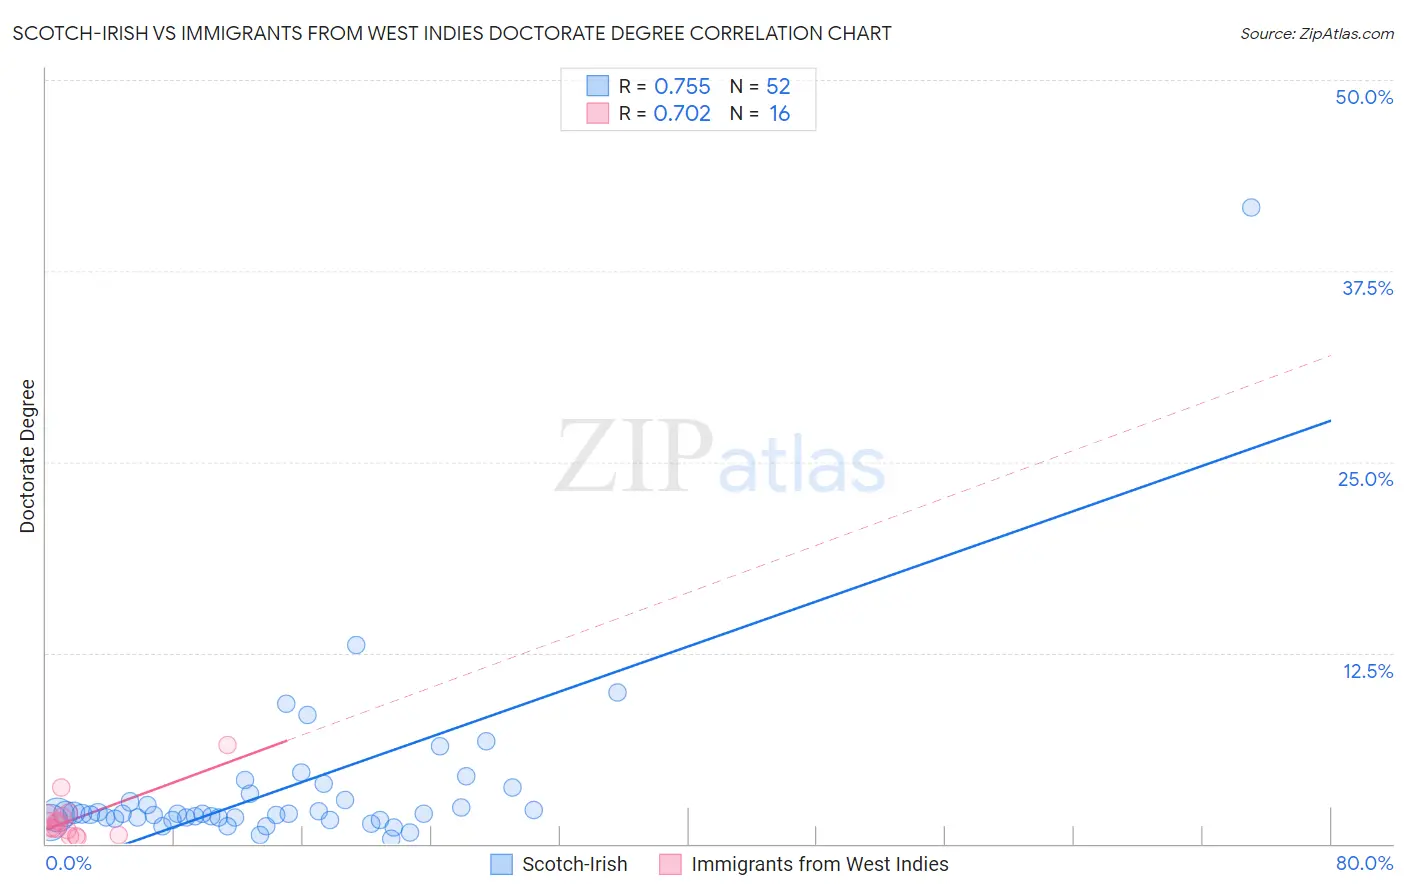
Scotch-Irish vs Immigrants from West Indies Doctorate Degree Correlation Chart
The statistical analysis conducted on geographies consisting of 527,994,945 people shows a strong positive correlation between the proportion of Scotch-Irish and percentage of population with at least doctorate degree education in the United States with a correlation coefficient (R) of 0.755 and weighted average of 1.9%. Similarly, the statistical analysis conducted on geographies consisting of 72,397,749 people shows a strong positive correlation between the proportion of Immigrants from West Indies and percentage of population with at least doctorate degree education in the United States with a correlation coefficient (R) of 0.702 and weighted average of 1.5%, a difference of 23.4%.
Doctorate Degree Correlation Summary
| Measurement | Scotch-Irish | Immigrants from West Indies |
| Minimum | 0.30% | 0.40% |
| Maximum | 41.7% | 6.4% |
| Range | 41.4% | 6.0% |
| Mean | 3.6% | 1.6% |
| Median | 1.9% | 1.2% |
| Interquartile 25% (IQ1) | 1.7% | 0.74% |
| Interquartile 75% (IQ3) | 3.1% | 1.8% |
| Interquartile Range (IQR) | 1.4% | 1.1% |
| Standard Deviation (Sample) | 5.9% | 1.5% |
| Standard Deviation (Population) | 5.9% | 1.5% |
Similar Demographics by Doctorate Degree
Demographics Similar to Scotch-Irish by Doctorate Degree
In terms of doctorate degree, the demographic groups most similar to Scotch-Irish are Spaniard (1.9%, a difference of 0.020%), Macedonian (1.9%, a difference of 0.41%), Celtic (1.9%, a difference of 0.49%), Sri Lankan (1.9%, a difference of 0.51%), and Czech (1.9%, a difference of 0.58%).
| Demographics | Rating | Rank | Doctorate Degree |
| Hungarians | 71.7 /100 | #158 | Good 1.9% |
| Slovenes | 70.2 /100 | #159 | Good 1.9% |
| Welsh | 69.7 /100 | #160 | Good 1.9% |
| Immigrants | Middle Africa | 68.8 /100 | #161 | Good 1.9% |
| Irish | 67.5 /100 | #162 | Good 1.9% |
| Czechs | 67.3 /100 | #163 | Good 1.9% |
| Celtics | 66.7 /100 | #164 | Good 1.9% |
| Scotch-Irish | 63.6 /100 | #165 | Good 1.9% |
| Spaniards | 63.5 /100 | #166 | Good 1.9% |
| Macedonians | 60.9 /100 | #167 | Good 1.9% |
| Sri Lankans | 60.3 /100 | #168 | Good 1.9% |
| Vietnamese | 54.8 /100 | #169 | Average 1.9% |
| Costa Ricans | 53.3 /100 | #170 | Average 1.8% |
| Bermudans | 52.1 /100 | #171 | Average 1.8% |
| Belgians | 50.3 /100 | #172 | Average 1.8% |
Demographics Similar to Immigrants from West Indies by Doctorate Degree
In terms of doctorate degree, the demographic groups most similar to Immigrants from West Indies are Liberian (1.5%, a difference of 0.030%), Japanese (1.5%, a difference of 0.12%), Chippewa (1.5%, a difference of 0.26%), Central American Indian (1.5%, a difference of 0.48%), and Immigrants from Cambodia (1.5%, a difference of 0.53%).
| Demographics | Rating | Rank | Doctorate Degree |
| Apache | 1.3 /100 | #251 | Tragic 1.5% |
| Yuman | 1.1 /100 | #252 | Tragic 1.5% |
| Americans | 1.0 /100 | #253 | Tragic 1.5% |
| Immigrants | Cambodia | 1.0 /100 | #254 | Tragic 1.5% |
| Trinidadians and Tobagonians | 1.0 /100 | #255 | Tragic 1.5% |
| Central American Indians | 1.0 /100 | #256 | Tragic 1.5% |
| Chippewa | 0.9 /100 | #257 | Tragic 1.5% |
| Immigrants | West Indies | 0.9 /100 | #258 | Tragic 1.5% |
| Liberians | 0.9 /100 | #259 | Tragic 1.5% |
| Japanese | 0.9 /100 | #260 | Tragic 1.5% |
| Immigrants | Portugal | 0.8 /100 | #261 | Tragic 1.5% |
| Chickasaw | 0.7 /100 | #262 | Tragic 1.5% |
| Immigrants | Bahamas | 0.7 /100 | #263 | Tragic 1.5% |
| Blackfeet | 0.7 /100 | #264 | Tragic 1.5% |
| Nicaraguans | 0.6 /100 | #265 | Tragic 1.5% |