Russian vs Immigrants from West Indies Doctorate Degree
COMPARE
Russian
Immigrants from West Indies
Doctorate Degree
Doctorate Degree Comparison
Russians
Immigrants from West Indies
2.6%
DOCTORATE DEGREE
100.0/ 100
METRIC RATING
38th/ 347
METRIC RANK
1.5%
DOCTORATE DEGREE
0.9/ 100
METRIC RATING
258th/ 347
METRIC RANK
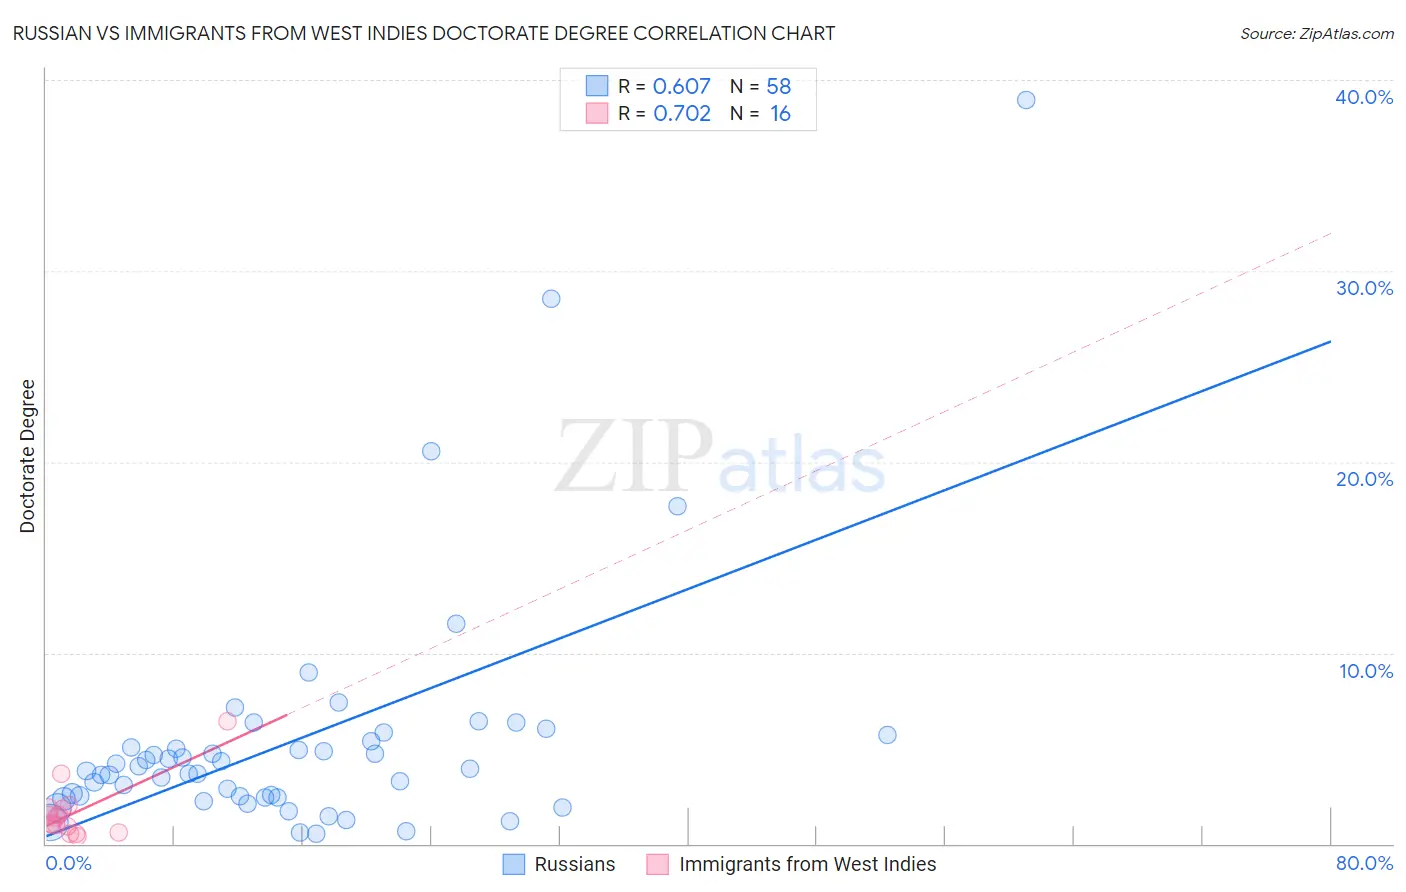
Russian vs Immigrants from West Indies Doctorate Degree Correlation Chart
The statistical analysis conducted on geographies consisting of 501,018,326 people shows a significant positive correlation between the proportion of Russians and percentage of population with at least doctorate degree education in the United States with a correlation coefficient (R) of 0.607 and weighted average of 2.6%. Similarly, the statistical analysis conducted on geographies consisting of 72,397,749 people shows a strong positive correlation between the proportion of Immigrants from West Indies and percentage of population with at least doctorate degree education in the United States with a correlation coefficient (R) of 0.702 and weighted average of 1.5%, a difference of 67.8%.
Doctorate Degree Correlation Summary
| Measurement | Russian | Immigrants from West Indies |
| Minimum | 0.50% | 0.40% |
| Maximum | 39.0% | 6.4% |
| Range | 38.5% | 6.0% |
| Mean | 5.4% | 1.6% |
| Median | 3.9% | 1.2% |
| Interquartile 25% (IQ1) | 2.4% | 0.74% |
| Interquartile 75% (IQ3) | 5.4% | 1.8% |
| Interquartile Range (IQR) | 2.9% | 1.1% |
| Standard Deviation (Sample) | 6.5% | 1.5% |
| Standard Deviation (Population) | 6.4% | 1.5% |
Similar Demographics by Doctorate Degree
Demographics Similar to Russians by Doctorate Degree
In terms of doctorate degree, the demographic groups most similar to Russians are Immigrants from Kuwait (2.6%, a difference of 0.15%), Immigrants from Spain (2.6%, a difference of 0.42%), Immigrants from Malaysia (2.6%, a difference of 0.48%), Immigrants from Ireland (2.5%, a difference of 0.49%), and Cypriot (2.6%, a difference of 0.53%).
| Demographics | Rating | Rank | Doctorate Degree |
| Latvians | 100.0 /100 | #31 | Exceptional 2.6% |
| Immigrants | Northern Europe | 100.0 /100 | #32 | Exceptional 2.6% |
| Cambodians | 100.0 /100 | #33 | Exceptional 2.6% |
| Cypriots | 100.0 /100 | #34 | Exceptional 2.6% |
| Immigrants | Malaysia | 100.0 /100 | #35 | Exceptional 2.6% |
| Immigrants | Spain | 100.0 /100 | #36 | Exceptional 2.6% |
| Immigrants | Kuwait | 100.0 /100 | #37 | Exceptional 2.6% |
| Russians | 100.0 /100 | #38 | Exceptional 2.6% |
| Immigrants | Ireland | 100.0 /100 | #39 | Exceptional 2.5% |
| Estonians | 100.0 /100 | #40 | Exceptional 2.5% |
| Immigrants | Russia | 100.0 /100 | #41 | Exceptional 2.5% |
| New Zealanders | 100.0 /100 | #42 | Exceptional 2.5% |
| Soviet Union | 100.0 /100 | #43 | Exceptional 2.5% |
| Immigrants | Netherlands | 100.0 /100 | #44 | Exceptional 2.5% |
| Immigrants | South Africa | 100.0 /100 | #45 | Exceptional 2.4% |
Demographics Similar to Immigrants from West Indies by Doctorate Degree
In terms of doctorate degree, the demographic groups most similar to Immigrants from West Indies are Liberian (1.5%, a difference of 0.030%), Japanese (1.5%, a difference of 0.12%), Chippewa (1.5%, a difference of 0.26%), Central American Indian (1.5%, a difference of 0.48%), and Immigrants from Cambodia (1.5%, a difference of 0.53%).
| Demographics | Rating | Rank | Doctorate Degree |
| Apache | 1.3 /100 | #251 | Tragic 1.5% |
| Yuman | 1.1 /100 | #252 | Tragic 1.5% |
| Americans | 1.0 /100 | #253 | Tragic 1.5% |
| Immigrants | Cambodia | 1.0 /100 | #254 | Tragic 1.5% |
| Trinidadians and Tobagonians | 1.0 /100 | #255 | Tragic 1.5% |
| Central American Indians | 1.0 /100 | #256 | Tragic 1.5% |
| Chippewa | 0.9 /100 | #257 | Tragic 1.5% |
| Immigrants | West Indies | 0.9 /100 | #258 | Tragic 1.5% |
| Liberians | 0.9 /100 | #259 | Tragic 1.5% |
| Japanese | 0.9 /100 | #260 | Tragic 1.5% |
| Immigrants | Portugal | 0.8 /100 | #261 | Tragic 1.5% |
| Chickasaw | 0.7 /100 | #262 | Tragic 1.5% |
| Immigrants | Bahamas | 0.7 /100 | #263 | Tragic 1.5% |
| Blackfeet | 0.7 /100 | #264 | Tragic 1.5% |
| Nicaraguans | 0.6 /100 | #265 | Tragic 1.5% |