Scotch-Irish vs Immigrants from West Indies Householder Income Ages 25 - 44 years
COMPARE
Scotch-Irish
Immigrants from West Indies
Householder Income Ages 25 - 44 years
Householder Income Ages 25 - 44 years Comparison
Scotch-Irish
Immigrants from West Indies
$89,969
HOUSEHOLDER INCOME AGES 25 - 44 YEARS
7.3/ 100
METRIC RATING
217th/ 347
METRIC RANK
$87,063
HOUSEHOLDER INCOME AGES 25 - 44 YEARS
1.5/ 100
METRIC RATING
243rd/ 347
METRIC RANK
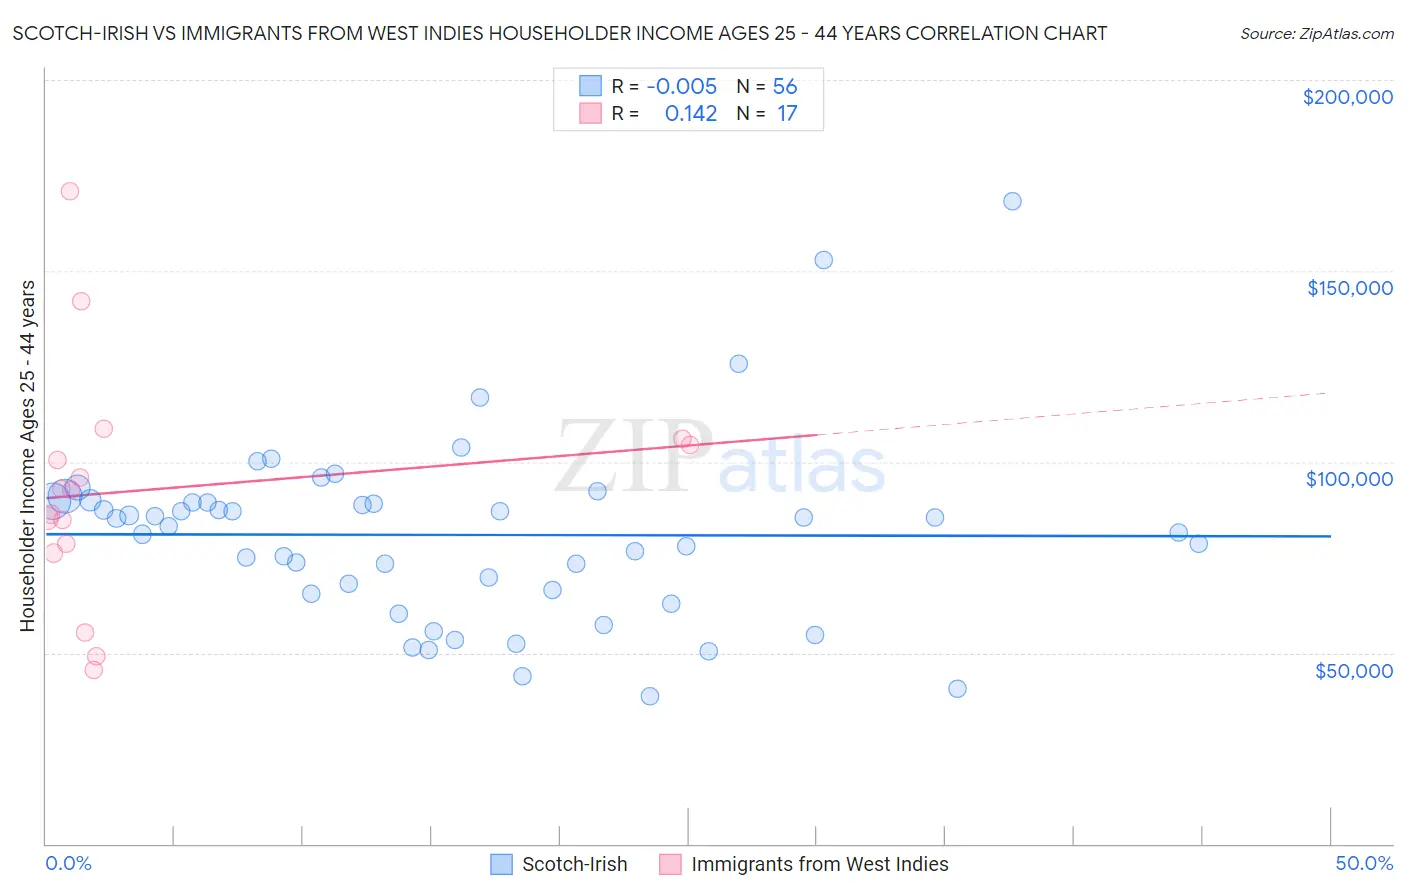
Scotch-Irish vs Immigrants from West Indies Householder Income Ages 25 - 44 years Correlation Chart
The statistical analysis conducted on geographies consisting of 544,063,779 people shows no correlation between the proportion of Scotch-Irish and household income with householder between the ages 25 and 44 in the United States with a correlation coefficient (R) of -0.005 and weighted average of $89,969. Similarly, the statistical analysis conducted on geographies consisting of 72,445,724 people shows a poor positive correlation between the proportion of Immigrants from West Indies and household income with householder between the ages 25 and 44 in the United States with a correlation coefficient (R) of 0.142 and weighted average of $87,063, a difference of 3.3%.
Householder Income Ages 25 - 44 years Correlation Summary
| Measurement | Scotch-Irish | Immigrants from West Indies |
| Minimum | $38,615 | $45,500 |
| Maximum | $168,086 | $170,707 |
| Range | $129,471 | $125,207 |
| Mean | $80,873 | $92,620 |
| Median | $84,225 | $92,679 |
| Interquartile 25% (IQ1) | $65,999 | $77,312 |
| Interquartile 75% (IQ3) | $89,511 | $105,207 |
| Interquartile Range (IQR) | $23,512 | $27,895 |
| Standard Deviation (Sample) | $23,988 | $30,962 |
| Standard Deviation (Population) | $23,773 | $30,037 |
Similar Demographics by Householder Income Ages 25 - 44 years
Demographics Similar to Scotch-Irish by Householder Income Ages 25 - 44 years
In terms of householder income ages 25 - 44 years, the demographic groups most similar to Scotch-Irish are Guyanese ($89,940, a difference of 0.030%), Delaware ($89,876, a difference of 0.10%), Trinidadian and Tobagonian ($89,856, a difference of 0.13%), Ghanaian ($90,137, a difference of 0.19%), and Panamanian ($90,193, a difference of 0.25%).
| Demographics | Rating | Rank | Householder Income Ages 25 - 44 years |
| Immigrants | Kenya | 10.9 /100 | #210 | Poor $90,767 |
| Iraqis | 10.8 /100 | #211 | Poor $90,764 |
| Hawaiians | 10.6 /100 | #212 | Poor $90,722 |
| Immigrants | Bangladesh | 9.3 /100 | #213 | Tragic $90,448 |
| Immigrants | Africa | 8.9 /100 | #214 | Tragic $90,372 |
| Panamanians | 8.1 /100 | #215 | Tragic $90,193 |
| Ghanaians | 7.9 /100 | #216 | Tragic $90,137 |
| Scotch-Irish | 7.3 /100 | #217 | Tragic $89,969 |
| Guyanese | 7.1 /100 | #218 | Tragic $89,940 |
| Delaware | 6.9 /100 | #219 | Tragic $89,876 |
| Trinidadians and Tobagonians | 6.8 /100 | #220 | Tragic $89,856 |
| Immigrants | Trinidad and Tobago | 6.5 /100 | #221 | Tragic $89,748 |
| Immigrants | Ecuador | 6.2 /100 | #222 | Tragic $89,673 |
| Immigrants | Guyana | 5.9 /100 | #223 | Tragic $89,586 |
| Barbadians | 5.9 /100 | #224 | Tragic $89,565 |
Demographics Similar to Immigrants from West Indies by Householder Income Ages 25 - 44 years
In terms of householder income ages 25 - 44 years, the demographic groups most similar to Immigrants from West Indies are Immigrants from Venezuela ($87,038, a difference of 0.030%), West Indian ($87,205, a difference of 0.16%), Immigrants from El Salvador ($86,913, a difference of 0.17%), Immigrants from Burma/Myanmar ($86,736, a difference of 0.38%), and Immigrants from Nigeria ($86,589, a difference of 0.55%).
| Demographics | Rating | Rank | Householder Income Ages 25 - 44 years |
| Immigrants | Cameroon | 2.9 /100 | #236 | Tragic $88,214 |
| Salvadorans | 2.8 /100 | #237 | Tragic $88,198 |
| Alaska Natives | 2.6 /100 | #238 | Tragic $88,018 |
| Immigrants | Ghana | 2.2 /100 | #239 | Tragic $87,760 |
| Nicaraguans | 2.2 /100 | #240 | Tragic $87,751 |
| Nigerians | 2.2 /100 | #241 | Tragic $87,730 |
| West Indians | 1.7 /100 | #242 | Tragic $87,205 |
| Immigrants | West Indies | 1.5 /100 | #243 | Tragic $87,063 |
| Immigrants | Venezuela | 1.5 /100 | #244 | Tragic $87,038 |
| Immigrants | El Salvador | 1.4 /100 | #245 | Tragic $86,913 |
| Immigrants | Burma/Myanmar | 1.3 /100 | #246 | Tragic $86,736 |
| Immigrants | Nigeria | 1.2 /100 | #247 | Tragic $86,589 |
| Immigrants | Sudan | 0.9 /100 | #248 | Tragic $86,109 |
| French American Indians | 0.8 /100 | #249 | Tragic $85,899 |
| Pennsylvania Germans | 0.8 /100 | #250 | Tragic $85,836 |