Dominican vs Immigrants from West Indies Doctorate Degree
COMPARE
Dominican
Immigrants from West Indies
Doctorate Degree
Doctorate Degree Comparison
Dominicans
Immigrants from West Indies
1.4%
DOCTORATE DEGREE
0.1/ 100
METRIC RATING
314th/ 347
METRIC RANK
1.5%
DOCTORATE DEGREE
0.9/ 100
METRIC RATING
258th/ 347
METRIC RANK
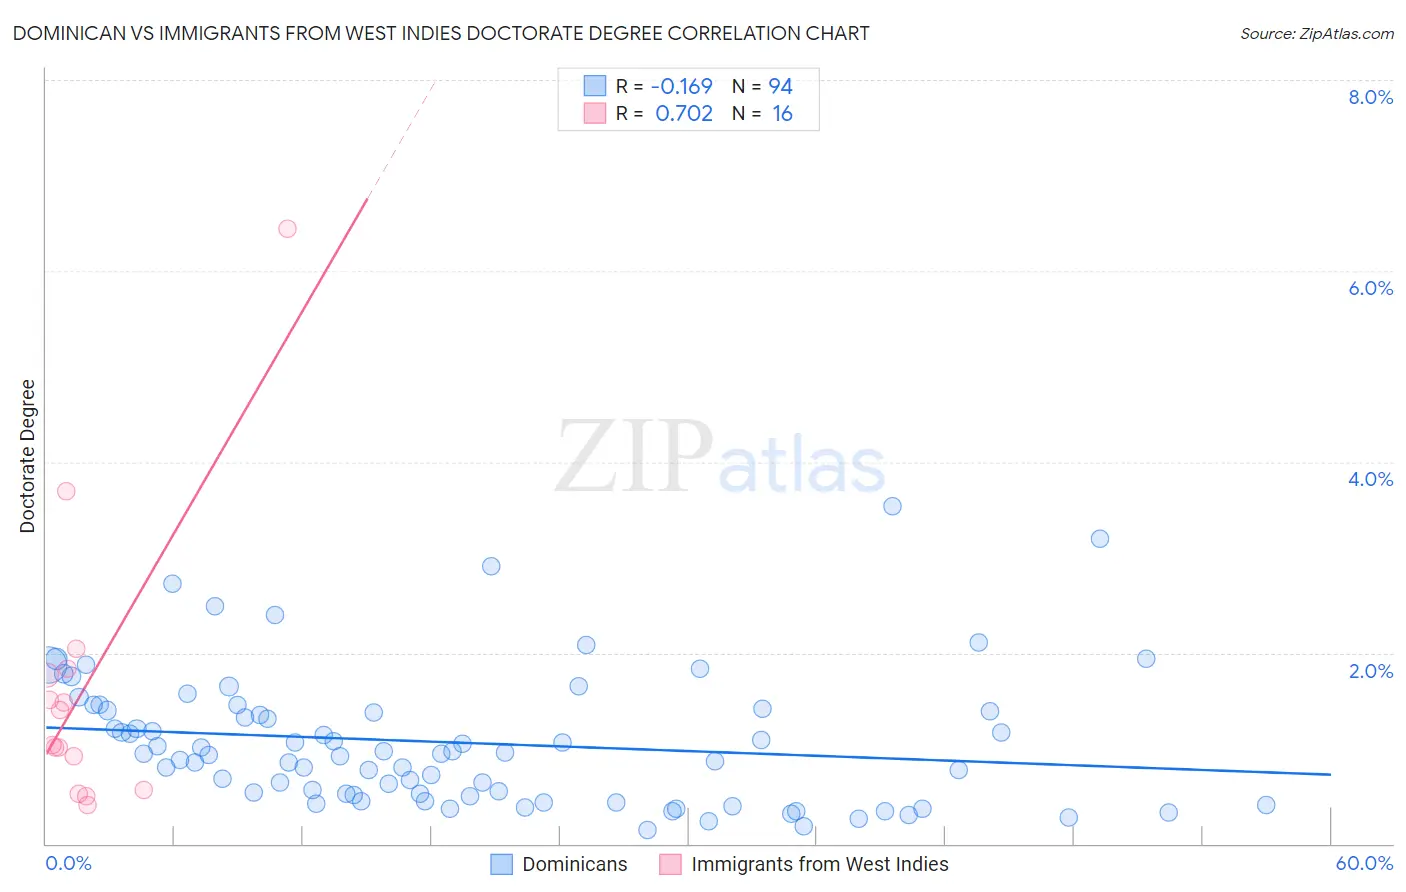
Dominican vs Immigrants from West Indies Doctorate Degree Correlation Chart
The statistical analysis conducted on geographies consisting of 351,566,637 people shows a poor negative correlation between the proportion of Dominicans and percentage of population with at least doctorate degree education in the United States with a correlation coefficient (R) of -0.169 and weighted average of 1.4%. Similarly, the statistical analysis conducted on geographies consisting of 72,397,749 people shows a strong positive correlation between the proportion of Immigrants from West Indies and percentage of population with at least doctorate degree education in the United States with a correlation coefficient (R) of 0.702 and weighted average of 1.5%, a difference of 12.3%.
Doctorate Degree Correlation Summary
| Measurement | Dominican | Immigrants from West Indies |
| Minimum | 0.14% | 0.40% |
| Maximum | 3.5% | 6.4% |
| Range | 3.4% | 6.0% |
| Mean | 1.1% | 1.6% |
| Median | 0.94% | 1.2% |
| Interquartile 25% (IQ1) | 0.51% | 0.74% |
| Interquartile 75% (IQ3) | 1.4% | 1.8% |
| Interquartile Range (IQR) | 0.88% | 1.1% |
| Standard Deviation (Sample) | 0.69% | 1.5% |
| Standard Deviation (Population) | 0.69% | 1.5% |
Similar Demographics by Doctorate Degree
Demographics Similar to Dominicans by Doctorate Degree
In terms of doctorate degree, the demographic groups most similar to Dominicans are Immigrants from the Azores (1.4%, a difference of 0.020%), Menominee (1.4%, a difference of 0.080%), Navajo (1.4%, a difference of 0.23%), Immigrants from Nicaragua (1.4%, a difference of 0.39%), and Immigrants from Micronesia (1.3%, a difference of 0.48%).
| Demographics | Rating | Rank | Doctorate Degree |
| Cubans | 0.1 /100 | #307 | Tragic 1.4% |
| Immigrants | Laos | 0.1 /100 | #308 | Tragic 1.4% |
| Immigrants | Grenada | 0.1 /100 | #309 | Tragic 1.4% |
| Immigrants | Jamaica | 0.1 /100 | #310 | Tragic 1.4% |
| Immigrants | Honduras | 0.1 /100 | #311 | Tragic 1.4% |
| Immigrants | Nicaragua | 0.1 /100 | #312 | Tragic 1.4% |
| Menominee | 0.1 /100 | #313 | Tragic 1.4% |
| Dominicans | 0.1 /100 | #314 | Tragic 1.4% |
| Immigrants | Azores | 0.1 /100 | #315 | Tragic 1.4% |
| Navajo | 0.1 /100 | #316 | Tragic 1.4% |
| Immigrants | Micronesia | 0.1 /100 | #317 | Tragic 1.3% |
| Creek | 0.1 /100 | #318 | Tragic 1.3% |
| Immigrants | Guyana | 0.1 /100 | #319 | Tragic 1.3% |
| Immigrants | St. Vincent and the Grenadines | 0.1 /100 | #320 | Tragic 1.3% |
| Dutch West Indians | 0.1 /100 | #321 | Tragic 1.3% |
Demographics Similar to Immigrants from West Indies by Doctorate Degree
In terms of doctorate degree, the demographic groups most similar to Immigrants from West Indies are Liberian (1.5%, a difference of 0.030%), Japanese (1.5%, a difference of 0.12%), Chippewa (1.5%, a difference of 0.26%), Central American Indian (1.5%, a difference of 0.48%), and Immigrants from Cambodia (1.5%, a difference of 0.53%).
| Demographics | Rating | Rank | Doctorate Degree |
| Apache | 1.3 /100 | #251 | Tragic 1.5% |
| Yuman | 1.1 /100 | #252 | Tragic 1.5% |
| Americans | 1.0 /100 | #253 | Tragic 1.5% |
| Immigrants | Cambodia | 1.0 /100 | #254 | Tragic 1.5% |
| Trinidadians and Tobagonians | 1.0 /100 | #255 | Tragic 1.5% |
| Central American Indians | 1.0 /100 | #256 | Tragic 1.5% |
| Chippewa | 0.9 /100 | #257 | Tragic 1.5% |
| Immigrants | West Indies | 0.9 /100 | #258 | Tragic 1.5% |
| Liberians | 0.9 /100 | #259 | Tragic 1.5% |
| Japanese | 0.9 /100 | #260 | Tragic 1.5% |
| Immigrants | Portugal | 0.8 /100 | #261 | Tragic 1.5% |
| Chickasaw | 0.7 /100 | #262 | Tragic 1.5% |
| Immigrants | Bahamas | 0.7 /100 | #263 | Tragic 1.5% |
| Blackfeet | 0.7 /100 | #264 | Tragic 1.5% |
| Nicaraguans | 0.6 /100 | #265 | Tragic 1.5% |