Jamaican vs Immigrants from Trinidad and Tobago 8th Grade
COMPARE
Jamaican
Immigrants from Trinidad and Tobago
8th Grade
8th Grade Comparison
Jamaicans
Immigrants from Trinidad and Tobago
95.1%
8TH GRADE
1.4/ 100
METRIC RATING
245th/ 347
METRIC RANK
94.6%
8TH GRADE
0.1/ 100
METRIC RATING
279th/ 347
METRIC RANK
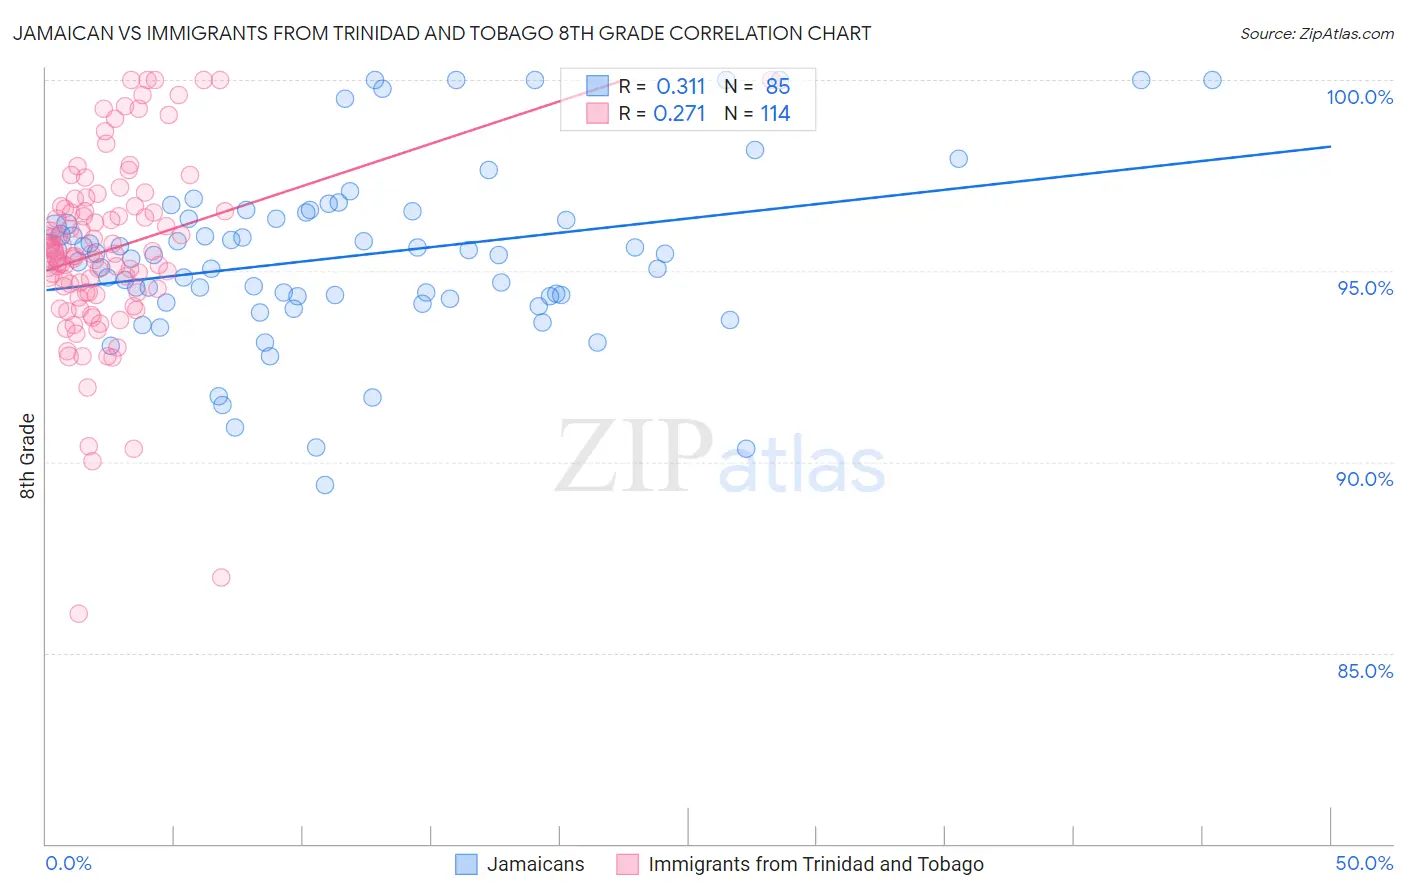
Jamaican vs Immigrants from Trinidad and Tobago 8th Grade Correlation Chart
The statistical analysis conducted on geographies consisting of 368,084,732 people shows a mild positive correlation between the proportion of Jamaicans and percentage of population with at least 8th grade education in the United States with a correlation coefficient (R) of 0.311 and weighted average of 95.1%. Similarly, the statistical analysis conducted on geographies consisting of 223,526,834 people shows a weak positive correlation between the proportion of Immigrants from Trinidad and Tobago and percentage of population with at least 8th grade education in the United States with a correlation coefficient (R) of 0.271 and weighted average of 94.6%, a difference of 0.46%.
8th Grade Correlation Summary
| Measurement | Jamaican | Immigrants from Trinidad and Tobago |
| Minimum | 89.4% | 86.0% |
| Maximum | 100.0% | 100.0% |
| Range | 10.6% | 14.0% |
| Mean | 95.4% | 95.5% |
| Median | 95.4% | 95.5% |
| Interquartile 25% (IQ1) | 94.3% | 94.4% |
| Interquartile 75% (IQ3) | 96.5% | 96.6% |
| Interquartile Range (IQR) | 2.2% | 2.2% |
| Standard Deviation (Sample) | 2.3% | 2.4% |
| Standard Deviation (Population) | 2.3% | 2.4% |
Similar Demographics by 8th Grade
Demographics Similar to Jamaicans by 8th Grade
In terms of 8th grade, the demographic groups most similar to Jamaicans are Somali (95.1%, a difference of 0.010%), Immigrants from Senegal (95.1%, a difference of 0.010%), Uruguayan (95.1%, a difference of 0.020%), Tongan (95.1%, a difference of 0.030%), and Paiute (95.1%, a difference of 0.030%).
| Demographics | Rating | Rank | 8th Grade |
| Natives/Alaskans | 2.3 /100 | #238 | Tragic 95.2% |
| Immigrants | Sierra Leone | 2.1 /100 | #239 | Tragic 95.1% |
| Ethiopians | 2.0 /100 | #240 | Tragic 95.1% |
| South American Indians | 1.9 /100 | #241 | Tragic 95.1% |
| Tongans | 1.7 /100 | #242 | Tragic 95.1% |
| Paiute | 1.7 /100 | #243 | Tragic 95.1% |
| Immigrants | Middle Africa | 1.7 /100 | #244 | Tragic 95.1% |
| Jamaicans | 1.4 /100 | #245 | Tragic 95.1% |
| Somalis | 1.4 /100 | #246 | Tragic 95.1% |
| Immigrants | Senegal | 1.4 /100 | #247 | Tragic 95.1% |
| Uruguayans | 1.2 /100 | #248 | Tragic 95.1% |
| Immigrants | China | 1.1 /100 | #249 | Tragic 95.0% |
| Koreans | 1.1 /100 | #250 | Tragic 95.0% |
| Bolivians | 1.0 /100 | #251 | Tragic 95.0% |
| Immigrants | Ethiopia | 1.0 /100 | #252 | Tragic 95.0% |
Demographics Similar to Immigrants from Trinidad and Tobago by 8th Grade
In terms of 8th grade, the demographic groups most similar to Immigrants from Trinidad and Tobago are Barbadian (94.6%, a difference of 0.0%), Armenian (94.7%, a difference of 0.010%), Immigrants from Bolivia (94.6%, a difference of 0.010%), Taiwanese (94.7%, a difference of 0.040%), and Immigrants from Eritrea (94.6%, a difference of 0.050%).
| Demographics | Rating | Rank | 8th Grade |
| Immigrants | South America | 0.2 /100 | #272 | Tragic 94.8% |
| Immigrants | Western Africa | 0.2 /100 | #273 | Tragic 94.8% |
| Trinidadians and Tobagonians | 0.2 /100 | #274 | Tragic 94.7% |
| Immigrants | Colombia | 0.2 /100 | #275 | Tragic 94.7% |
| Peruvians | 0.1 /100 | #276 | Tragic 94.7% |
| Taiwanese | 0.1 /100 | #277 | Tragic 94.7% |
| Armenians | 0.1 /100 | #278 | Tragic 94.7% |
| Immigrants | Trinidad and Tobago | 0.1 /100 | #279 | Tragic 94.6% |
| Barbadians | 0.1 /100 | #280 | Tragic 94.6% |
| Immigrants | Bolivia | 0.1 /100 | #281 | Tragic 94.6% |
| Immigrants | Eritrea | 0.1 /100 | #282 | Tragic 94.6% |
| Immigrants | St. Vincent and the Grenadines | 0.1 /100 | #283 | Tragic 94.6% |
| Immigrants | Philippines | 0.1 /100 | #284 | Tragic 94.6% |
| Immigrants | Barbados | 0.0 /100 | #285 | Tragic 94.5% |
| Immigrants | Peru | 0.0 /100 | #286 | Tragic 94.5% |