Romanian vs Cheyenne 8th Grade
COMPARE
Romanian
Cheyenne
8th Grade
8th Grade Comparison
Romanians
Cheyenne
96.5%
8TH GRADE
99.2/ 100
METRIC RATING
81st/ 347
METRIC RANK
96.1%
8TH GRADE
93.3/ 100
METRIC RATING
129th/ 347
METRIC RANK
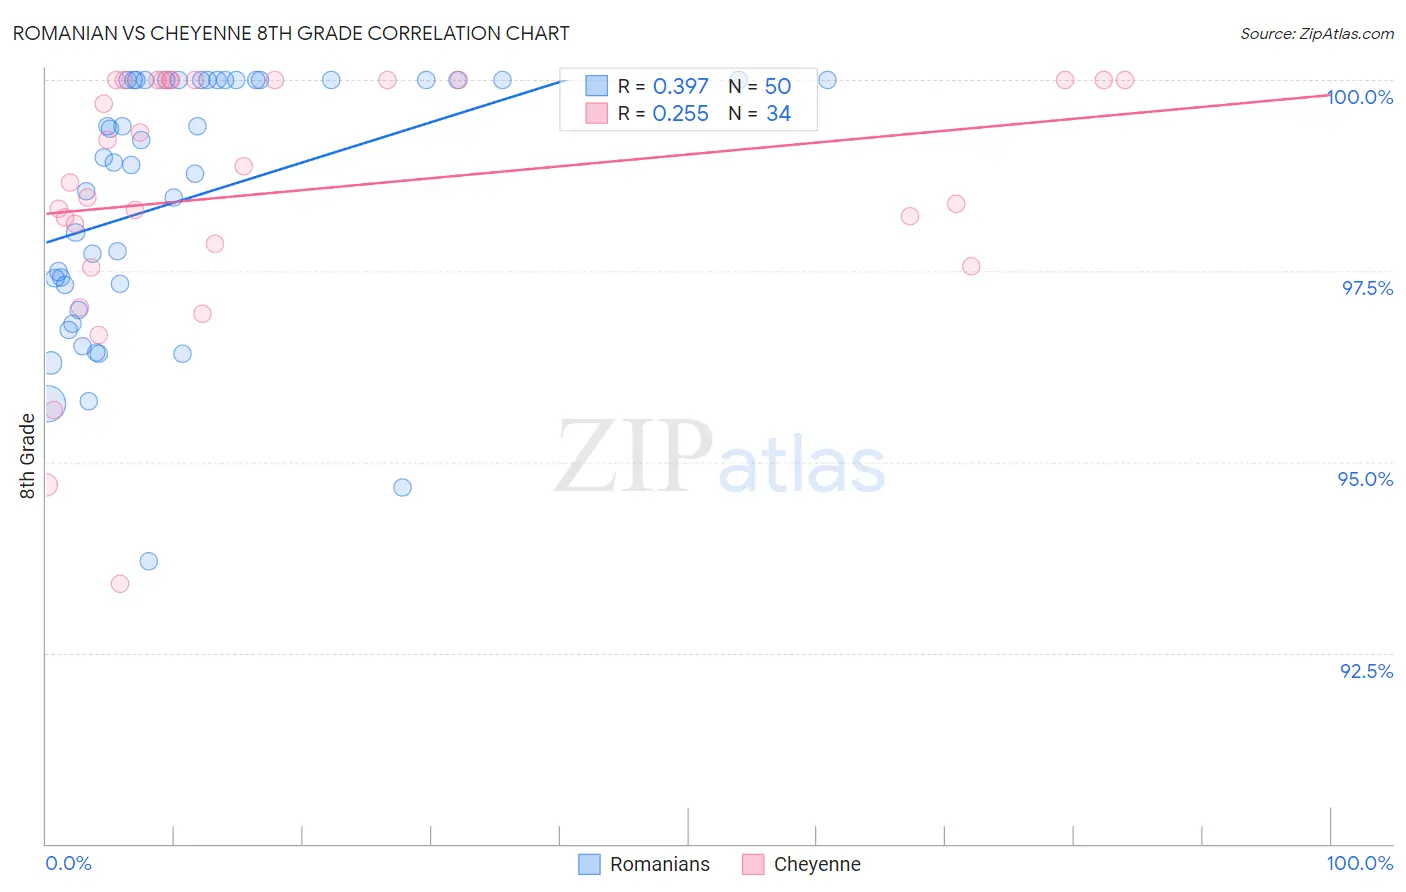
Romanian vs Cheyenne 8th Grade Correlation Chart
The statistical analysis conducted on geographies consisting of 377,904,438 people shows a mild positive correlation between the proportion of Romanians and percentage of population with at least 8th grade education in the United States with a correlation coefficient (R) of 0.397 and weighted average of 96.5%. Similarly, the statistical analysis conducted on geographies consisting of 80,719,411 people shows a weak positive correlation between the proportion of Cheyenne and percentage of population with at least 8th grade education in the United States with a correlation coefficient (R) of 0.255 and weighted average of 96.1%, a difference of 0.36%.
8th Grade Correlation Summary
| Measurement | Romanian | Cheyenne |
| Minimum | 93.7% | 93.4% |
| Maximum | 100.0% | 100.0% |
| Range | 6.3% | 6.6% |
| Mean | 98.4% | 98.6% |
| Median | 99.0% | 98.8% |
| Interquartile 25% (IQ1) | 97.3% | 97.8% |
| Interquartile 75% (IQ3) | 100.0% | 100.0% |
| Interquartile Range (IQR) | 2.7% | 2.2% |
| Standard Deviation (Sample) | 1.7% | 1.7% |
| Standard Deviation (Population) | 1.7% | 1.6% |
Similar Demographics by 8th Grade
Demographics Similar to Romanians by 8th Grade
In terms of 8th grade, the demographic groups most similar to Romanians are Delaware (96.5%, a difference of 0.0%), Turkish (96.5%, a difference of 0.0%), Icelander (96.5%, a difference of 0.010%), Puget Sound Salish (96.5%, a difference of 0.020%), and Immigrants from Belgium (96.5%, a difference of 0.020%).
| Demographics | Rating | Rank | 8th Grade |
| Immigrants | Ireland | 99.5 /100 | #74 | Exceptional 96.5% |
| Zimbabweans | 99.4 /100 | #75 | Exceptional 96.5% |
| Immigrants | Netherlands | 99.4 /100 | #76 | Exceptional 96.5% |
| Cypriots | 99.4 /100 | #77 | Exceptional 96.5% |
| Yugoslavians | 99.4 /100 | #78 | Exceptional 96.5% |
| Puget Sound Salish | 99.3 /100 | #79 | Exceptional 96.5% |
| Delaware | 99.2 /100 | #80 | Exceptional 96.5% |
| Romanians | 99.2 /100 | #81 | Exceptional 96.5% |
| Turks | 99.2 /100 | #82 | Exceptional 96.5% |
| Icelanders | 99.2 /100 | #83 | Exceptional 96.5% |
| Immigrants | Belgium | 99.1 /100 | #84 | Exceptional 96.5% |
| Immigrants | South Africa | 99.1 /100 | #85 | Exceptional 96.5% |
| Cherokee | 99.0 /100 | #86 | Exceptional 96.5% |
| Immigrants | Australia | 99.0 /100 | #87 | Exceptional 96.5% |
| Immigrants | Western Europe | 99.0 /100 | #88 | Exceptional 96.4% |
Demographics Similar to Cheyenne by 8th Grade
In terms of 8th grade, the demographic groups most similar to Cheyenne are Immigrants from Bosnia and Herzegovina (96.2%, a difference of 0.010%), Immigrants from Romania (96.2%, a difference of 0.020%), Choctaw (96.2%, a difference of 0.020%), Immigrants from Serbia (96.2%, a difference of 0.020%), and Soviet Union (96.1%, a difference of 0.020%).
| Demographics | Rating | Rank | 8th Grade |
| Immigrants | Europe | 95.3 /100 | #122 | Exceptional 96.2% |
| Filipinos | 94.6 /100 | #123 | Exceptional 96.2% |
| Palestinians | 94.6 /100 | #124 | Exceptional 96.2% |
| Immigrants | Romania | 94.1 /100 | #125 | Exceptional 96.2% |
| Choctaw | 94.0 /100 | #126 | Exceptional 96.2% |
| Immigrants | Serbia | 94.0 /100 | #127 | Exceptional 96.2% |
| Immigrants | Bosnia and Herzegovina | 93.9 /100 | #128 | Exceptional 96.2% |
| Cheyenne | 93.3 /100 | #129 | Exceptional 96.1% |
| Soviet Union | 92.6 /100 | #130 | Exceptional 96.1% |
| Pueblo | 92.3 /100 | #131 | Exceptional 96.1% |
| Immigrants | Kuwait | 92.2 /100 | #132 | Exceptional 96.1% |
| Immigrants | Turkey | 91.7 /100 | #133 | Exceptional 96.1% |
| Immigrants | Hungary | 91.5 /100 | #134 | Exceptional 96.1% |
| Basques | 91.5 /100 | #135 | Exceptional 96.1% |
| Jordanians | 91.3 /100 | #136 | Exceptional 96.1% |