Immigrants from Venezuela vs Nonimmigrants Doctorate Degree
COMPARE
Immigrants from Venezuela
Nonimmigrants
Doctorate Degree
Doctorate Degree Comparison
Immigrants from Venezuela
Nonimmigrants
1.7%
DOCTORATE DEGREE
8.7/ 100
METRIC RATING
222nd/ 347
METRIC RANK
1.7%
DOCTORATE DEGREE
8.8/ 100
METRIC RATING
221st/ 347
METRIC RANK
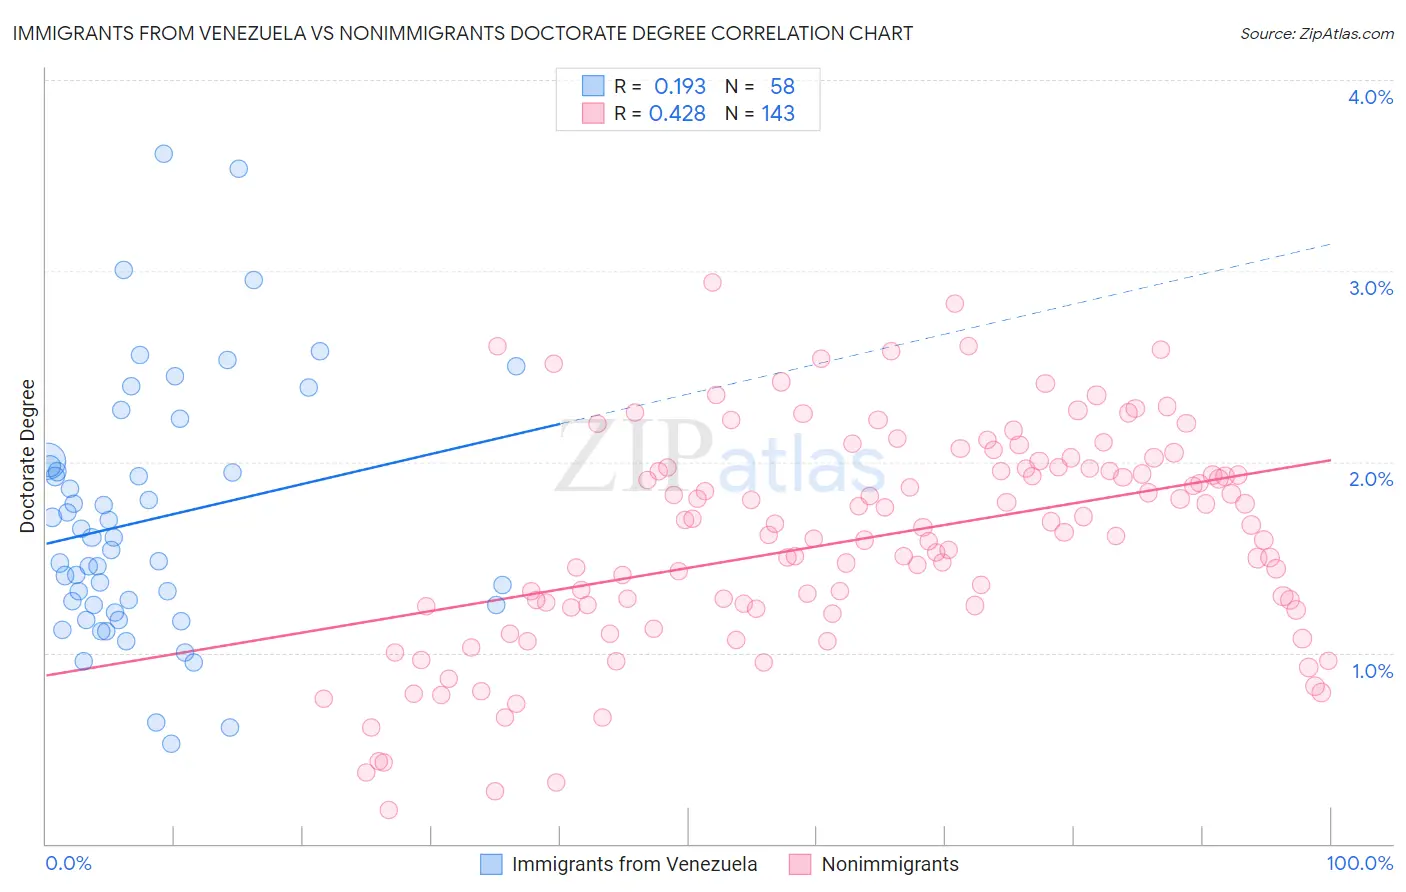
Immigrants from Venezuela vs Nonimmigrants Doctorate Degree Correlation Chart
The statistical analysis conducted on geographies consisting of 286,408,537 people shows a poor positive correlation between the proportion of Immigrants from Venezuela and percentage of population with at least doctorate degree education in the United States with a correlation coefficient (R) of 0.193 and weighted average of 1.7%. Similarly, the statistical analysis conducted on geographies consisting of 553,265,434 people shows a moderate positive correlation between the proportion of Nonimmigrants and percentage of population with at least doctorate degree education in the United States with a correlation coefficient (R) of 0.428 and weighted average of 1.7%, a difference of 0.070%.
Doctorate Degree Correlation Summary
| Measurement | Immigrants from Venezuela | Nonimmigrants |
| Minimum | 0.53% | 0.18% |
| Maximum | 3.6% | 2.9% |
| Range | 3.1% | 2.8% |
| Mean | 1.7% | 1.6% |
| Median | 1.6% | 1.7% |
| Interquartile 25% (IQ1) | 1.2% | 1.2% |
| Interquartile 75% (IQ3) | 2.0% | 2.0% |
| Interquartile Range (IQR) | 0.73% | 0.73% |
| Standard Deviation (Sample) | 0.67% | 0.57% |
| Standard Deviation (Population) | 0.66% | 0.56% |
Demographics Similar to Immigrants from Venezuela and Nonimmigrants by Doctorate Degree
In terms of doctorate degree, the demographic groups most similar to Immigrants from Venezuela are Immigrants from Uruguay (1.7%, a difference of 0.26%), Immigrants from Bosnia and Herzegovina (1.7%, a difference of 0.46%), Immigrants from Poland (1.7%, a difference of 0.68%), Immigrants from Iraq (1.7%, a difference of 0.92%), and Immigrants from Colombia (1.7%, a difference of 1.2%). Similarly, the demographic groups most similar to Nonimmigrants are Immigrants from Uruguay (1.7%, a difference of 0.19%), Immigrants from Bosnia and Herzegovina (1.7%, a difference of 0.53%), Immigrants from Poland (1.7%, a difference of 0.75%), Immigrants from Iraq (1.7%, a difference of 0.85%), and Immigrants from Colombia (1.7%, a difference of 1.2%).
| Demographics | Rating | Rank | Doctorate Degree |
| Immigrants | Armenia | 15.1 /100 | #211 | Poor 1.7% |
| Immigrants | South Eastern Asia | 14.7 /100 | #212 | Poor 1.7% |
| Koreans | 14.2 /100 | #213 | Poor 1.7% |
| Pueblo | 14.2 /100 | #214 | Poor 1.7% |
| Alaskan Athabascans | 13.8 /100 | #215 | Poor 1.7% |
| Immigrants | Burma/Myanmar | 13.5 /100 | #216 | Poor 1.7% |
| Spanish Americans | 12.9 /100 | #217 | Poor 1.7% |
| Tlingit-Haida | 11.9 /100 | #218 | Poor 1.7% |
| Immigrants | Iraq | 10.7 /100 | #219 | Poor 1.7% |
| Immigrants | Uruguay | 9.2 /100 | #220 | Tragic 1.7% |
| Immigrants | Nonimmigrants | 8.8 /100 | #221 | Tragic 1.7% |
| Immigrants | Venezuela | 8.7 /100 | #222 | Tragic 1.7% |
| Immigrants | Bosnia and Herzegovina | 7.8 /100 | #223 | Tragic 1.7% |
| Immigrants | Poland | 7.4 /100 | #224 | Tragic 1.7% |
| Immigrants | Colombia | 6.7 /100 | #225 | Tragic 1.7% |
| Osage | 6.5 /100 | #226 | Tragic 1.7% |
| Panamanians | 6.3 /100 | #227 | Tragic 1.7% |
| Assyrians/Chaldeans/Syriacs | 5.9 /100 | #228 | Tragic 1.7% |
| Colville | 4.7 /100 | #229 | Tragic 1.6% |
| Immigrants | Philippines | 4.3 /100 | #230 | Tragic 1.6% |
| Immigrants | North Macedonia | 3.9 /100 | #231 | Tragic 1.6% |