Shoshone vs Nonimmigrants Doctorate Degree
COMPARE
Shoshone
Nonimmigrants
Doctorate Degree
Doctorate Degree Comparison
Shoshone
Nonimmigrants
1.4%
DOCTORATE DEGREE
0.1/ 100
METRIC RATING
302nd/ 347
METRIC RANK
1.7%
DOCTORATE DEGREE
8.8/ 100
METRIC RATING
221st/ 347
METRIC RANK
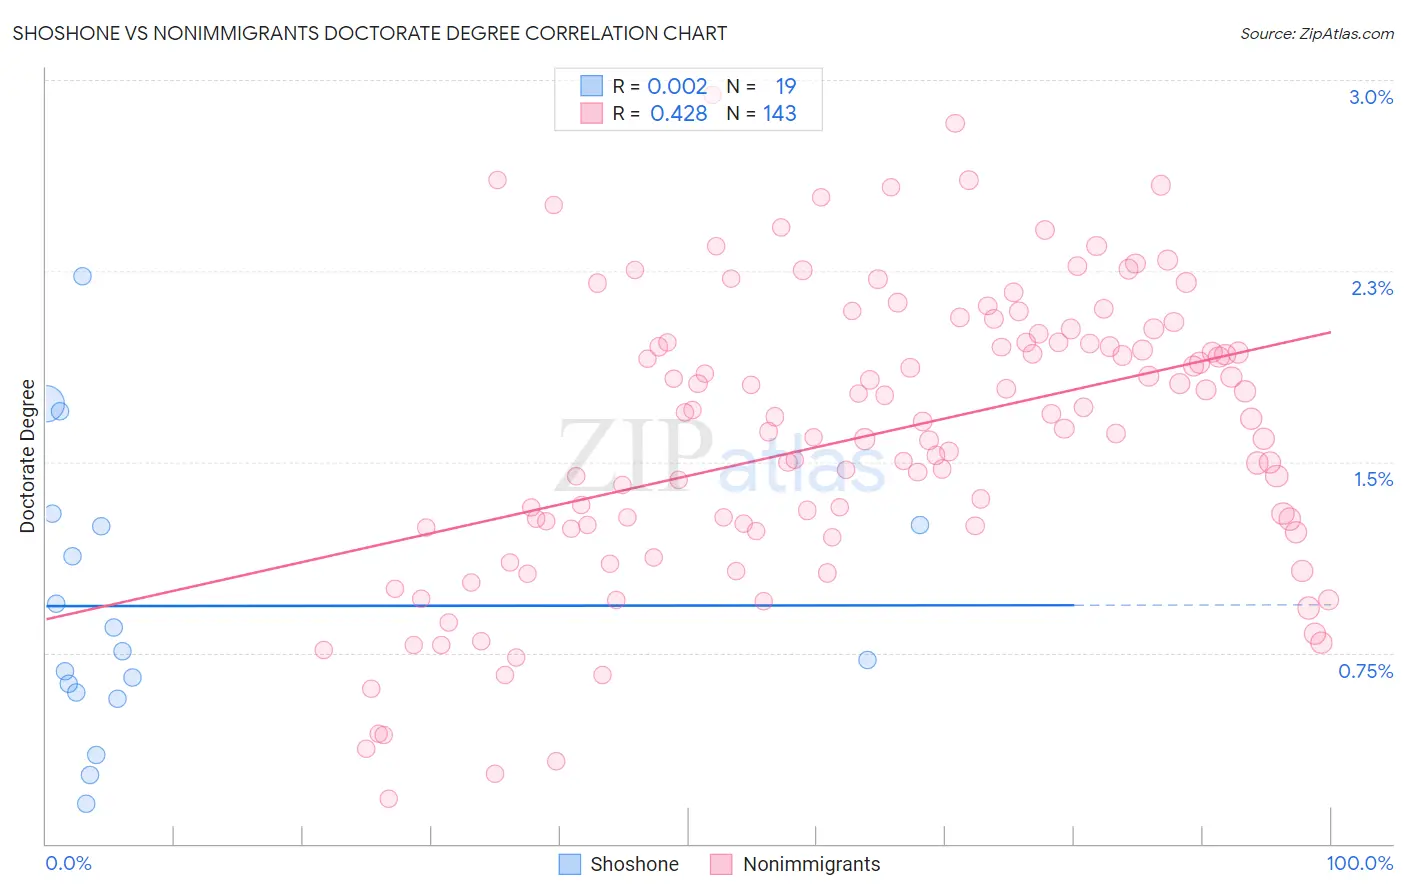
Shoshone vs Nonimmigrants Doctorate Degree Correlation Chart
The statistical analysis conducted on geographies consisting of 66,163,741 people shows no correlation between the proportion of Shoshone and percentage of population with at least doctorate degree education in the United States with a correlation coefficient (R) of 0.002 and weighted average of 1.4%. Similarly, the statistical analysis conducted on geographies consisting of 553,265,434 people shows a moderate positive correlation between the proportion of Nonimmigrants and percentage of population with at least doctorate degree education in the United States with a correlation coefficient (R) of 0.428 and weighted average of 1.7%, a difference of 21.5%.
Doctorate Degree Correlation Summary
| Measurement | Shoshone | Nonimmigrants |
| Minimum | 0.16% | 0.18% |
| Maximum | 2.2% | 2.9% |
| Range | 2.1% | 2.8% |
| Mean | 0.93% | 1.6% |
| Median | 0.75% | 1.7% |
| Interquartile 25% (IQ1) | 0.60% | 1.2% |
| Interquartile 75% (IQ3) | 1.3% | 2.0% |
| Interquartile Range (IQR) | 0.65% | 0.73% |
| Standard Deviation (Sample) | 0.54% | 0.57% |
| Standard Deviation (Population) | 0.52% | 0.56% |
Similar Demographics by Doctorate Degree
Demographics Similar to Shoshone by Doctorate Degree
In terms of doctorate degree, the demographic groups most similar to Shoshone are Immigrants from Dominica (1.4%, a difference of 0.030%), Mexican American Indian (1.4%, a difference of 0.090%), Pennsylvania German (1.4%, a difference of 0.22%), Guyanese (1.4%, a difference of 0.23%), and Honduran (1.4%, a difference of 0.33%).
| Demographics | Rating | Rank | Doctorate Degree |
| Guatemalans | 0.2 /100 | #295 | Tragic 1.4% |
| Immigrants | Ecuador | 0.2 /100 | #296 | Tragic 1.4% |
| Tsimshian | 0.2 /100 | #297 | Tragic 1.4% |
| Puerto Ricans | 0.1 /100 | #298 | Tragic 1.4% |
| Belizeans | 0.1 /100 | #299 | Tragic 1.4% |
| Immigrants | Guatemala | 0.1 /100 | #300 | Tragic 1.4% |
| Hondurans | 0.1 /100 | #301 | Tragic 1.4% |
| Shoshone | 0.1 /100 | #302 | Tragic 1.4% |
| Immigrants | Dominica | 0.1 /100 | #303 | Tragic 1.4% |
| Mexican American Indians | 0.1 /100 | #304 | Tragic 1.4% |
| Pennsylvania Germans | 0.1 /100 | #305 | Tragic 1.4% |
| Guyanese | 0.1 /100 | #306 | Tragic 1.4% |
| Cubans | 0.1 /100 | #307 | Tragic 1.4% |
| Immigrants | Laos | 0.1 /100 | #308 | Tragic 1.4% |
| Immigrants | Grenada | 0.1 /100 | #309 | Tragic 1.4% |
Demographics Similar to Nonimmigrants by Doctorate Degree
In terms of doctorate degree, the demographic groups most similar to Nonimmigrants are Immigrants from Venezuela (1.7%, a difference of 0.070%), Immigrants from Uruguay (1.7%, a difference of 0.19%), Immigrants from Bosnia and Herzegovina (1.7%, a difference of 0.53%), Immigrants from Poland (1.7%, a difference of 0.75%), and Immigrants from Iraq (1.7%, a difference of 0.85%).
| Demographics | Rating | Rank | Doctorate Degree |
| Pueblo | 14.2 /100 | #214 | Poor 1.7% |
| Alaskan Athabascans | 13.8 /100 | #215 | Poor 1.7% |
| Immigrants | Burma/Myanmar | 13.5 /100 | #216 | Poor 1.7% |
| Spanish Americans | 12.9 /100 | #217 | Poor 1.7% |
| Tlingit-Haida | 11.9 /100 | #218 | Poor 1.7% |
| Immigrants | Iraq | 10.7 /100 | #219 | Poor 1.7% |
| Immigrants | Uruguay | 9.2 /100 | #220 | Tragic 1.7% |
| Immigrants | Nonimmigrants | 8.8 /100 | #221 | Tragic 1.7% |
| Immigrants | Venezuela | 8.7 /100 | #222 | Tragic 1.7% |
| Immigrants | Bosnia and Herzegovina | 7.8 /100 | #223 | Tragic 1.7% |
| Immigrants | Poland | 7.4 /100 | #224 | Tragic 1.7% |
| Immigrants | Colombia | 6.7 /100 | #225 | Tragic 1.7% |
| Osage | 6.5 /100 | #226 | Tragic 1.7% |
| Panamanians | 6.3 /100 | #227 | Tragic 1.7% |
| Assyrians/Chaldeans/Syriacs | 5.9 /100 | #228 | Tragic 1.7% |