Immigrants from Saudi Arabia vs Nonimmigrants Doctorate Degree
COMPARE
Immigrants from Saudi Arabia
Nonimmigrants
Doctorate Degree
Doctorate Degree Comparison
Immigrants from Saudi Arabia
Nonimmigrants
2.7%
DOCTORATE DEGREE
100.0/ 100
METRIC RATING
25th/ 347
METRIC RANK
1.7%
DOCTORATE DEGREE
8.8/ 100
METRIC RATING
221st/ 347
METRIC RANK
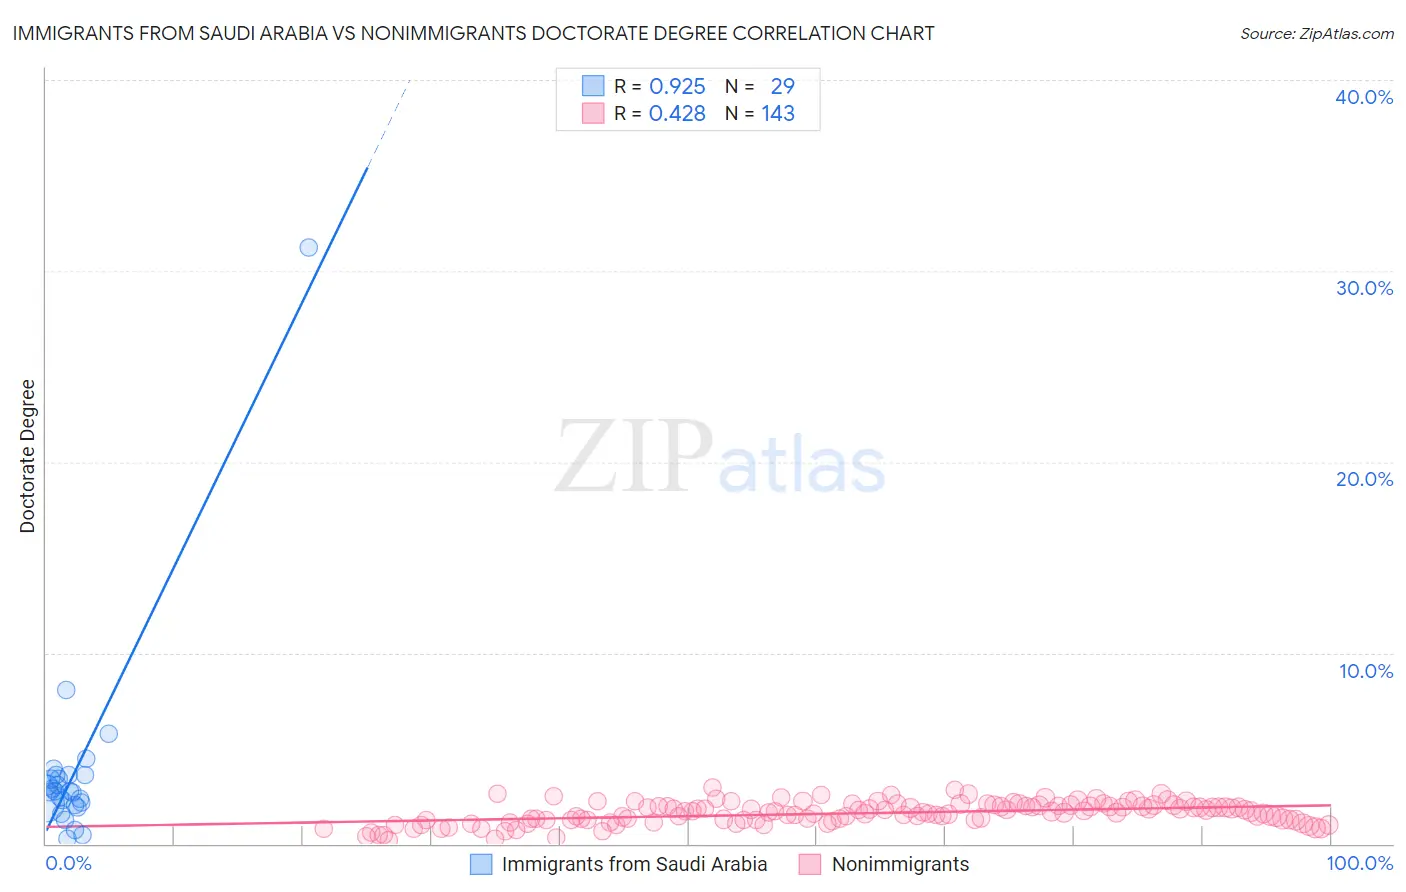
Immigrants from Saudi Arabia vs Nonimmigrants Doctorate Degree Correlation Chart
The statistical analysis conducted on geographies consisting of 164,069,044 people shows a near-perfect positive correlation between the proportion of Immigrants from Saudi Arabia and percentage of population with at least doctorate degree education in the United States with a correlation coefficient (R) of 0.925 and weighted average of 2.7%. Similarly, the statistical analysis conducted on geographies consisting of 553,265,434 people shows a moderate positive correlation between the proportion of Nonimmigrants and percentage of population with at least doctorate degree education in the United States with a correlation coefficient (R) of 0.428 and weighted average of 1.7%, a difference of 59.4%.
Doctorate Degree Correlation Summary
| Measurement | Immigrants from Saudi Arabia | Nonimmigrants |
| Minimum | 0.29% | 0.18% |
| Maximum | 31.2% | 2.9% |
| Range | 31.0% | 2.8% |
| Mean | 3.8% | 1.6% |
| Median | 2.7% | 1.7% |
| Interquartile 25% (IQ1) | 2.1% | 1.2% |
| Interquartile 75% (IQ3) | 3.6% | 2.0% |
| Interquartile Range (IQR) | 1.5% | 0.73% |
| Standard Deviation (Sample) | 5.5% | 0.57% |
| Standard Deviation (Population) | 5.4% | 0.56% |
Similar Demographics by Doctorate Degree
Demographics Similar to Immigrants from Saudi Arabia by Doctorate Degree
In terms of doctorate degree, the demographic groups most similar to Immigrants from Saudi Arabia are Turkish (2.7%, a difference of 0.52%), Immigrants from Turkey (2.6%, a difference of 1.4%), Israeli (2.7%, a difference of 1.5%), Burmese (2.6%, a difference of 1.7%), and Immigrants from South Central Asia (2.6%, a difference of 2.0%).
| Demographics | Rating | Rank | Doctorate Degree |
| Immigrants | Sri Lanka | 100.0 /100 | #18 | Exceptional 2.8% |
| Immigrants | Japan | 100.0 /100 | #19 | Exceptional 2.8% |
| Immigrants | Hong Kong | 100.0 /100 | #20 | Exceptional 2.8% |
| Thais | 100.0 /100 | #21 | Exceptional 2.8% |
| Mongolians | 100.0 /100 | #22 | Exceptional 2.8% |
| Immigrants | Denmark | 100.0 /100 | #23 | Exceptional 2.8% |
| Israelis | 100.0 /100 | #24 | Exceptional 2.7% |
| Immigrants | Saudi Arabia | 100.0 /100 | #25 | Exceptional 2.7% |
| Turks | 100.0 /100 | #26 | Exceptional 2.7% |
| Immigrants | Turkey | 100.0 /100 | #27 | Exceptional 2.6% |
| Burmese | 100.0 /100 | #28 | Exceptional 2.6% |
| Immigrants | South Central Asia | 100.0 /100 | #29 | Exceptional 2.6% |
| Immigrants | Korea | 100.0 /100 | #30 | Exceptional 2.6% |
| Latvians | 100.0 /100 | #31 | Exceptional 2.6% |
| Immigrants | Northern Europe | 100.0 /100 | #32 | Exceptional 2.6% |
Demographics Similar to Nonimmigrants by Doctorate Degree
In terms of doctorate degree, the demographic groups most similar to Nonimmigrants are Immigrants from Venezuela (1.7%, a difference of 0.070%), Immigrants from Uruguay (1.7%, a difference of 0.19%), Immigrants from Bosnia and Herzegovina (1.7%, a difference of 0.53%), Immigrants from Poland (1.7%, a difference of 0.75%), and Immigrants from Iraq (1.7%, a difference of 0.85%).
| Demographics | Rating | Rank | Doctorate Degree |
| Pueblo | 14.2 /100 | #214 | Poor 1.7% |
| Alaskan Athabascans | 13.8 /100 | #215 | Poor 1.7% |
| Immigrants | Burma/Myanmar | 13.5 /100 | #216 | Poor 1.7% |
| Spanish Americans | 12.9 /100 | #217 | Poor 1.7% |
| Tlingit-Haida | 11.9 /100 | #218 | Poor 1.7% |
| Immigrants | Iraq | 10.7 /100 | #219 | Poor 1.7% |
| Immigrants | Uruguay | 9.2 /100 | #220 | Tragic 1.7% |
| Immigrants | Nonimmigrants | 8.8 /100 | #221 | Tragic 1.7% |
| Immigrants | Venezuela | 8.7 /100 | #222 | Tragic 1.7% |
| Immigrants | Bosnia and Herzegovina | 7.8 /100 | #223 | Tragic 1.7% |
| Immigrants | Poland | 7.4 /100 | #224 | Tragic 1.7% |
| Immigrants | Colombia | 6.7 /100 | #225 | Tragic 1.7% |
| Osage | 6.5 /100 | #226 | Tragic 1.7% |
| Panamanians | 6.3 /100 | #227 | Tragic 1.7% |
| Assyrians/Chaldeans/Syriacs | 5.9 /100 | #228 | Tragic 1.7% |