Immigrants from China vs Immigrants from Korea Associate's Degree
COMPARE
Immigrants from China
Immigrants from Korea
Associate's Degree
Associate's Degree Comparison
Immigrants from China
Immigrants from Korea
55.5%
ASSOCIATE'S DEGREE
100.0/ 100
METRIC RATING
13th/ 347
METRIC RANK
54.5%
ASSOCIATE'S DEGREE
100.0/ 100
METRIC RATING
24th/ 347
METRIC RANK
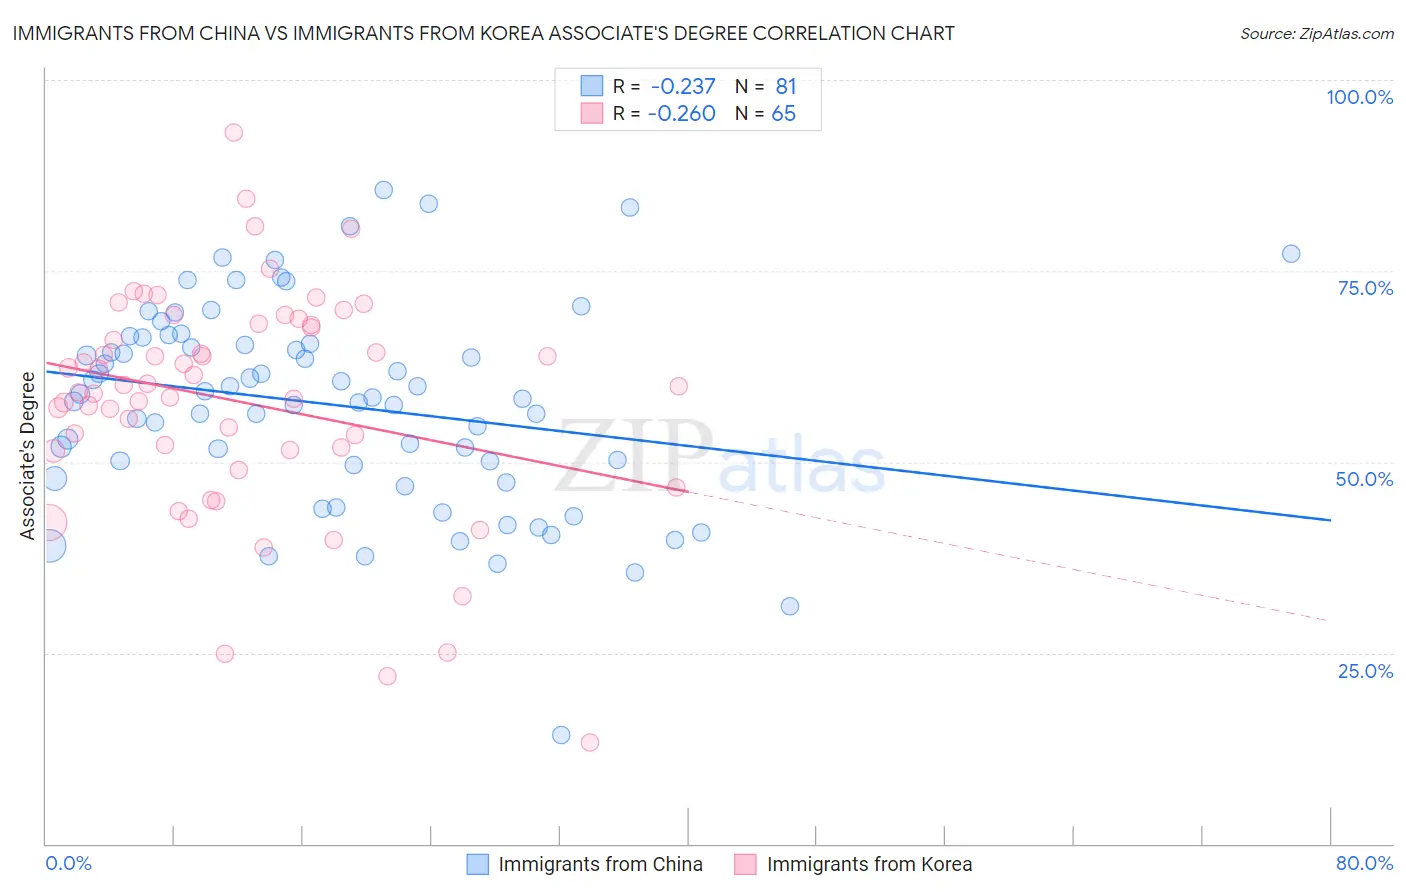
Immigrants from China vs Immigrants from Korea Associate's Degree Correlation Chart
The statistical analysis conducted on geographies consisting of 457,025,047 people shows a weak negative correlation between the proportion of Immigrants from China and percentage of population with at least associate's degree education in the United States with a correlation coefficient (R) of -0.237 and weighted average of 55.5%. Similarly, the statistical analysis conducted on geographies consisting of 416,302,592 people shows a weak negative correlation between the proportion of Immigrants from Korea and percentage of population with at least associate's degree education in the United States with a correlation coefficient (R) of -0.260 and weighted average of 54.5%, a difference of 1.7%.
Associate's Degree Correlation Summary
| Measurement | Immigrants from China | Immigrants from Korea |
| Minimum | 14.2% | 13.3% |
| Maximum | 85.6% | 93.1% |
| Range | 71.4% | 79.9% |
| Mean | 57.5% | 57.9% |
| Median | 58.5% | 59.9% |
| Interquartile 25% (IQ1) | 48.7% | 51.4% |
| Interquartile 75% (IQ3) | 65.9% | 68.0% |
| Interquartile Range (IQR) | 17.2% | 16.5% |
| Standard Deviation (Sample) | 13.4% | 14.9% |
| Standard Deviation (Population) | 13.3% | 14.8% |
Demographics Similar to Immigrants from China and Immigrants from Korea by Associate's Degree
In terms of associate's degree, the demographic groups most similar to Immigrants from China are Immigrants from Hong Kong (55.4%, a difference of 0.14%), Immigrants from Eastern Asia (55.4%, a difference of 0.17%), Immigrants from South Central Asia (55.7%, a difference of 0.49%), Immigrants from Australia (55.8%, a difference of 0.61%), and Soviet Union (55.1%, a difference of 0.65%). Similarly, the demographic groups most similar to Immigrants from Korea are Immigrants from Switzerland (54.5%, a difference of 0.030%), Immigrants from Belgium (54.5%, a difference of 0.070%), Immigrants from Japan (54.6%, a difference of 0.090%), Burmese (54.6%, a difference of 0.090%), and Immigrants from Sweden (54.6%, a difference of 0.12%).
| Demographics | Rating | Rank | Associate's Degree |
| Thais | 100.0 /100 | #8 | Exceptional 57.4% |
| Immigrants | Israel | 100.0 /100 | #9 | Exceptional 56.8% |
| Cypriots | 100.0 /100 | #10 | Exceptional 56.4% |
| Immigrants | Australia | 100.0 /100 | #11 | Exceptional 55.8% |
| Immigrants | South Central Asia | 100.0 /100 | #12 | Exceptional 55.7% |
| Immigrants | China | 100.0 /100 | #13 | Exceptional 55.5% |
| Immigrants | Hong Kong | 100.0 /100 | #14 | Exceptional 55.4% |
| Immigrants | Eastern Asia | 100.0 /100 | #15 | Exceptional 55.4% |
| Soviet Union | 100.0 /100 | #16 | Exceptional 55.1% |
| Eastern Europeans | 100.0 /100 | #17 | Exceptional 55.0% |
| Indians (Asian) | 100.0 /100 | #18 | Exceptional 54.8% |
| Immigrants | Ireland | 100.0 /100 | #19 | Exceptional 54.7% |
| Cambodians | 100.0 /100 | #20 | Exceptional 54.6% |
| Immigrants | Sweden | 100.0 /100 | #21 | Exceptional 54.6% |
| Immigrants | Japan | 100.0 /100 | #22 | Exceptional 54.6% |
| Burmese | 100.0 /100 | #23 | Exceptional 54.6% |
| Immigrants | Korea | 100.0 /100 | #24 | Exceptional 54.5% |
| Immigrants | Switzerland | 100.0 /100 | #25 | Exceptional 54.5% |
| Immigrants | Belgium | 100.0 /100 | #26 | Exceptional 54.5% |
| Latvians | 100.0 /100 | #27 | Exceptional 53.9% |
| Turks | 100.0 /100 | #28 | Exceptional 53.9% |