Danish vs Immigrants from Korea Associate's Degree
COMPARE
Danish
Immigrants from Korea
Associate's Degree
Associate's Degree Comparison
Danes
Immigrants from Korea
47.4%
ASSOCIATE'S DEGREE
77.3/ 100
METRIC RATING
147th/ 347
METRIC RANK
54.5%
ASSOCIATE'S DEGREE
100.0/ 100
METRIC RATING
24th/ 347
METRIC RANK
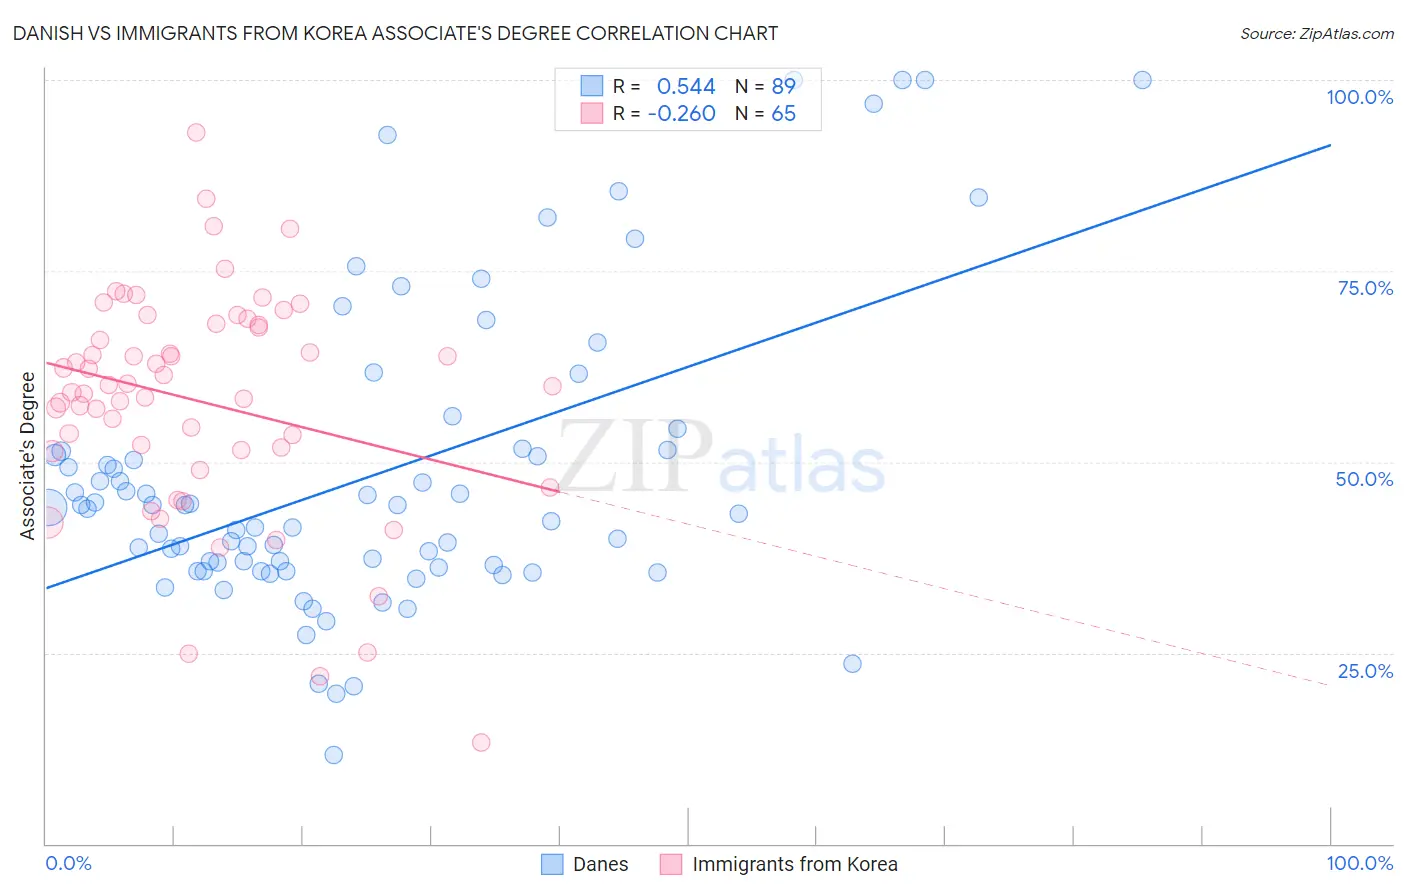
Danish vs Immigrants from Korea Associate's Degree Correlation Chart
The statistical analysis conducted on geographies consisting of 474,170,437 people shows a substantial positive correlation between the proportion of Danes and percentage of population with at least associate's degree education in the United States with a correlation coefficient (R) of 0.544 and weighted average of 47.4%. Similarly, the statistical analysis conducted on geographies consisting of 416,302,592 people shows a weak negative correlation between the proportion of Immigrants from Korea and percentage of population with at least associate's degree education in the United States with a correlation coefficient (R) of -0.260 and weighted average of 54.5%, a difference of 15.0%.
Associate's Degree Correlation Summary
| Measurement | Danish | Immigrants from Korea |
| Minimum | 11.7% | 13.3% |
| Maximum | 100.0% | 93.1% |
| Range | 88.3% | 79.9% |
| Mean | 48.1% | 57.9% |
| Median | 43.9% | 59.9% |
| Interquartile 25% (IQ1) | 36.0% | 51.4% |
| Interquartile 75% (IQ3) | 51.5% | 68.0% |
| Interquartile Range (IQR) | 15.5% | 16.5% |
| Standard Deviation (Sample) | 19.6% | 14.9% |
| Standard Deviation (Population) | 19.5% | 14.8% |
Similar Demographics by Associate's Degree
Demographics Similar to Danes by Associate's Degree
In terms of associate's degree, the demographic groups most similar to Danes are Immigrants from Sudan (47.4%, a difference of 0.050%), South American Indian (47.4%, a difference of 0.060%), Immigrants from Armenia (47.4%, a difference of 0.070%), Iraqi (47.4%, a difference of 0.11%), and Immigrants from North Macedonia (47.4%, a difference of 0.14%).
| Demographics | Rating | Rank | Associate's Degree |
| Immigrants | Southern Europe | 84.4 /100 | #140 | Excellent 47.8% |
| Taiwanese | 83.3 /100 | #141 | Excellent 47.7% |
| Sierra Leoneans | 82.9 /100 | #142 | Excellent 47.7% |
| Norwegians | 81.0 /100 | #143 | Excellent 47.6% |
| Slavs | 80.5 /100 | #144 | Excellent 47.6% |
| Canadians | 79.0 /100 | #145 | Good 47.5% |
| Immigrants | Sudan | 77.9 /100 | #146 | Good 47.4% |
| Danes | 77.3 /100 | #147 | Good 47.4% |
| South American Indians | 76.7 /100 | #148 | Good 47.4% |
| Immigrants | Armenia | 76.6 /100 | #149 | Good 47.4% |
| Iraqis | 76.2 /100 | #150 | Good 47.4% |
| Immigrants | North Macedonia | 76.0 /100 | #151 | Good 47.4% |
| Immigrants | Afghanistan | 74.3 /100 | #152 | Good 47.3% |
| Czechs | 72.2 /100 | #153 | Good 47.2% |
| Immigrants | Kenya | 72.1 /100 | #154 | Good 47.2% |
Demographics Similar to Immigrants from Korea by Associate's Degree
In terms of associate's degree, the demographic groups most similar to Immigrants from Korea are Immigrants from Switzerland (54.5%, a difference of 0.030%), Immigrants from Belgium (54.5%, a difference of 0.070%), Immigrants from Japan (54.6%, a difference of 0.090%), Burmese (54.6%, a difference of 0.090%), and Immigrants from Sweden (54.6%, a difference of 0.12%).
| Demographics | Rating | Rank | Associate's Degree |
| Eastern Europeans | 100.0 /100 | #17 | Exceptional 55.0% |
| Indians (Asian) | 100.0 /100 | #18 | Exceptional 54.8% |
| Immigrants | Ireland | 100.0 /100 | #19 | Exceptional 54.7% |
| Cambodians | 100.0 /100 | #20 | Exceptional 54.6% |
| Immigrants | Sweden | 100.0 /100 | #21 | Exceptional 54.6% |
| Immigrants | Japan | 100.0 /100 | #22 | Exceptional 54.6% |
| Burmese | 100.0 /100 | #23 | Exceptional 54.6% |
| Immigrants | Korea | 100.0 /100 | #24 | Exceptional 54.5% |
| Immigrants | Switzerland | 100.0 /100 | #25 | Exceptional 54.5% |
| Immigrants | Belgium | 100.0 /100 | #26 | Exceptional 54.5% |
| Latvians | 100.0 /100 | #27 | Exceptional 53.9% |
| Turks | 100.0 /100 | #28 | Exceptional 53.9% |
| Immigrants | France | 100.0 /100 | #29 | Exceptional 53.9% |
| Immigrants | Sri Lanka | 100.0 /100 | #30 | Exceptional 53.7% |
| Immigrants | Northern Europe | 100.0 /100 | #31 | Exceptional 53.5% |