Scandinavian vs Yugoslavian GED/Equivalency
COMPARE
Scandinavian
Yugoslavian
GED/Equivalency
GED/Equivalency Comparison
Scandinavians
Yugoslavians
87.9%
GED/EQUIVALENCY
99.3/ 100
METRIC RATING
60th/ 347
METRIC RANK
86.7%
GED/EQUIVALENCY
89.5/ 100
METRIC RATING
128th/ 347
METRIC RANK
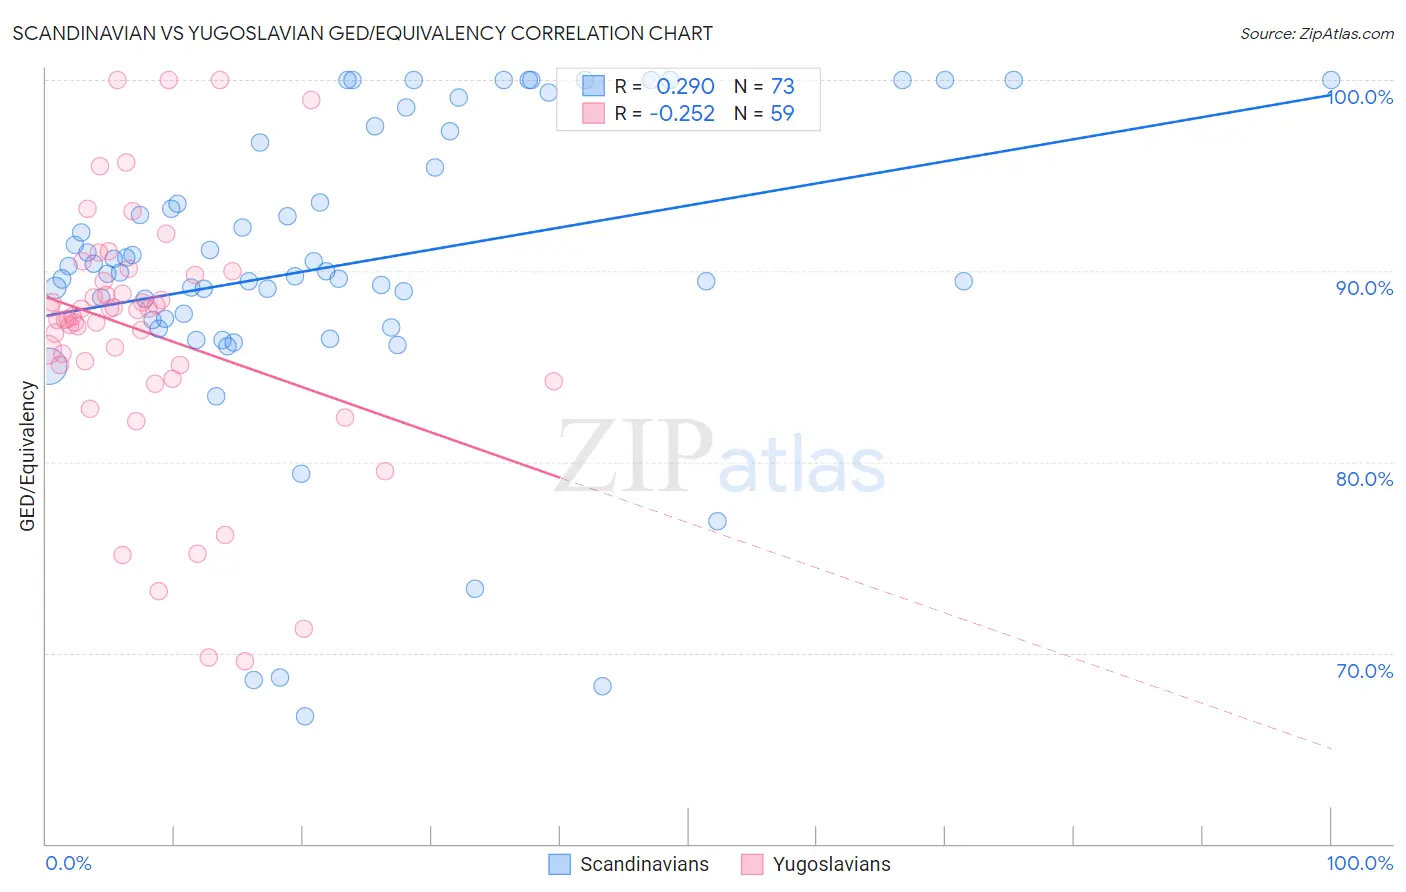
Scandinavian vs Yugoslavian GED/Equivalency Correlation Chart
The statistical analysis conducted on geographies consisting of 472,660,435 people shows a weak positive correlation between the proportion of Scandinavians and percentage of population with at least ged/equivalency education in the United States with a correlation coefficient (R) of 0.290 and weighted average of 87.9%. Similarly, the statistical analysis conducted on geographies consisting of 285,719,638 people shows a weak negative correlation between the proportion of Yugoslavians and percentage of population with at least ged/equivalency education in the United States with a correlation coefficient (R) of -0.252 and weighted average of 86.7%, a difference of 1.4%.
GED/Equivalency Correlation Summary
| Measurement | Scandinavian | Yugoslavian |
| Minimum | 66.7% | 69.6% |
| Maximum | 100.0% | 100.0% |
| Range | 33.3% | 30.4% |
| Mean | 90.3% | 86.8% |
| Median | 90.0% | 87.6% |
| Interquartile 25% (IQ1) | 87.5% | 85.1% |
| Interquartile 75% (IQ3) | 97.0% | 89.8% |
| Interquartile Range (IQR) | 9.6% | 4.7% |
| Standard Deviation (Sample) | 7.9% | 6.7% |
| Standard Deviation (Population) | 7.8% | 6.6% |
Similar Demographics by GED/Equivalency
Demographics Similar to Scandinavians by GED/Equivalency
In terms of ged/equivalency, the demographic groups most similar to Scandinavians are European (87.9%, a difference of 0.0%), Serbian (87.9%, a difference of 0.010%), Immigrants from Czechoslovakia (87.9%, a difference of 0.020%), Northern European (87.9%, a difference of 0.020%), and German (87.9%, a difference of 0.020%).
| Demographics | Rating | Rank | GED/Equivalency |
| Immigrants | South Africa | 99.4 /100 | #53 | Exceptional 88.0% |
| Soviet Union | 99.4 /100 | #54 | Exceptional 88.0% |
| New Zealanders | 99.4 /100 | #55 | Exceptional 88.0% |
| Immigrants | Denmark | 99.4 /100 | #56 | Exceptional 88.0% |
| Immigrants | Czechoslovakia | 99.3 /100 | #57 | Exceptional 87.9% |
| Northern Europeans | 99.3 /100 | #58 | Exceptional 87.9% |
| Serbians | 99.3 /100 | #59 | Exceptional 87.9% |
| Scandinavians | 99.3 /100 | #60 | Exceptional 87.9% |
| Europeans | 99.3 /100 | #61 | Exceptional 87.9% |
| Germans | 99.3 /100 | #62 | Exceptional 87.9% |
| Immigrants | Turkey | 99.2 /100 | #63 | Exceptional 87.9% |
| Immigrants | Canada | 99.2 /100 | #64 | Exceptional 87.9% |
| Immigrants | North America | 99.1 /100 | #65 | Exceptional 87.8% |
| Immigrants | Bulgaria | 99.1 /100 | #66 | Exceptional 87.8% |
| British | 99.1 /100 | #67 | Exceptional 87.8% |
Demographics Similar to Yugoslavians by GED/Equivalency
In terms of ged/equivalency, the demographic groups most similar to Yugoslavians are Argentinean (86.7%, a difference of 0.010%), Immigrants from Ukraine (86.7%, a difference of 0.030%), Immigrants from Germany (86.7%, a difference of 0.030%), Asian (86.7%, a difference of 0.040%), and Immigrants from Egypt (86.7%, a difference of 0.050%).
| Demographics | Rating | Rank | GED/Equivalency |
| Immigrants | Lebanon | 90.9 /100 | #121 | Exceptional 86.8% |
| Immigrants | Jordan | 90.8 /100 | #122 | Exceptional 86.8% |
| Immigrants | Italy | 90.5 /100 | #123 | Exceptional 86.7% |
| Immigrants | Egypt | 90.4 /100 | #124 | Exceptional 86.7% |
| Celtics | 90.4 /100 | #125 | Exceptional 86.7% |
| Asians | 90.3 /100 | #126 | Exceptional 86.7% |
| Argentineans | 89.7 /100 | #127 | Excellent 86.7% |
| Yugoslavians | 89.5 /100 | #128 | Excellent 86.7% |
| Immigrants | Ukraine | 88.9 /100 | #129 | Excellent 86.7% |
| Immigrants | Germany | 88.8 /100 | #130 | Excellent 86.7% |
| Immigrants | Spain | 88.5 /100 | #131 | Excellent 86.7% |
| Immigrants | Brazil | 88.4 /100 | #132 | Excellent 86.6% |
| Tsimshian | 88.3 /100 | #133 | Excellent 86.6% |
| Albanians | 87.7 /100 | #134 | Excellent 86.6% |
| Immigrants | Asia | 87.4 /100 | #135 | Excellent 86.6% |