Indonesian vs Arab Associate's Degree
COMPARE
Indonesian
Arab
Associate's Degree
Associate's Degree Comparison
Indonesians
Arabs
41.9%
ASSOCIATE'S DEGREE
0.6/ 100
METRIC RATING
253rd/ 347
METRIC RANK
49.0%
ASSOCIATE'S DEGREE
95.3/ 100
METRIC RATING
114th/ 347
METRIC RANK
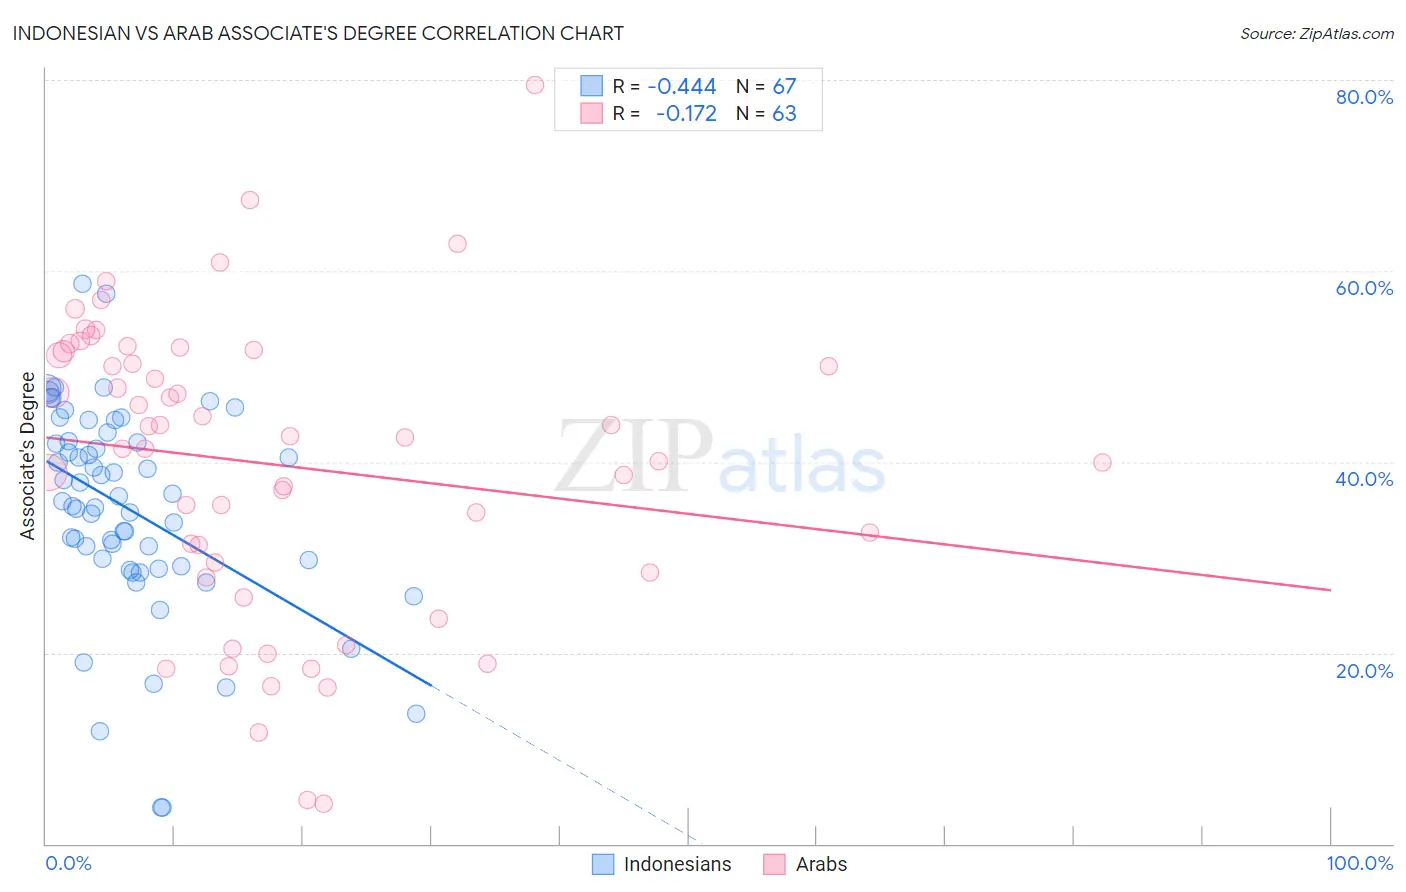
Indonesian vs Arab Associate's Degree Correlation Chart
The statistical analysis conducted on geographies consisting of 162,722,822 people shows a moderate negative correlation between the proportion of Indonesians and percentage of population with at least associate's degree education in the United States with a correlation coefficient (R) of -0.444 and weighted average of 41.9%. Similarly, the statistical analysis conducted on geographies consisting of 486,836,450 people shows a poor negative correlation between the proportion of Arabs and percentage of population with at least associate's degree education in the United States with a correlation coefficient (R) of -0.172 and weighted average of 49.0%, a difference of 16.8%.
Associate's Degree Correlation Summary
| Measurement | Indonesian | Arab |
| Minimum | 3.8% | 4.3% |
| Maximum | 58.7% | 79.5% |
| Range | 54.9% | 75.3% |
| Mean | 35.0% | 39.7% |
| Median | 35.9% | 42.6% |
| Interquartile 25% (IQ1) | 29.0% | 28.4% |
| Interquartile 75% (IQ3) | 42.1% | 51.6% |
| Interquartile Range (IQR) | 13.1% | 23.3% |
| Standard Deviation (Sample) | 11.0% | 15.6% |
| Standard Deviation (Population) | 10.9% | 15.5% |
Similar Demographics by Associate's Degree
Demographics Similar to Indonesians by Associate's Degree
In terms of associate's degree, the demographic groups most similar to Indonesians are Cuban (41.9%, a difference of 0.060%), French American Indian (42.0%, a difference of 0.10%), Immigrants from Guyana (41.8%, a difference of 0.15%), Immigrants from Congo (41.8%, a difference of 0.28%), and Spanish American (41.8%, a difference of 0.34%).
| Demographics | Rating | Rank | Associate's Degree |
| Delaware | 0.9 /100 | #246 | Tragic 42.3% |
| Immigrants | Fiji | 0.8 /100 | #247 | Tragic 42.2% |
| Immigrants | Ecuador | 0.8 /100 | #248 | Tragic 42.2% |
| Jamaicans | 0.7 /100 | #249 | Tragic 42.1% |
| U.S. Virgin Islanders | 0.7 /100 | #250 | Tragic 42.1% |
| Immigrants | Bahamas | 0.7 /100 | #251 | Tragic 42.1% |
| French American Indians | 0.6 /100 | #252 | Tragic 42.0% |
| Indonesians | 0.6 /100 | #253 | Tragic 41.9% |
| Cubans | 0.6 /100 | #254 | Tragic 41.9% |
| Immigrants | Guyana | 0.5 /100 | #255 | Tragic 41.8% |
| Immigrants | Congo | 0.5 /100 | #256 | Tragic 41.8% |
| Spanish Americans | 0.5 /100 | #257 | Tragic 41.8% |
| Japanese | 0.5 /100 | #258 | Tragic 41.7% |
| Malaysians | 0.4 /100 | #259 | Tragic 41.6% |
| Marshallese | 0.4 /100 | #260 | Tragic 41.6% |
Demographics Similar to Arabs by Associate's Degree
In terms of associate's degree, the demographic groups most similar to Arabs are Immigrants from Chile (49.0%, a difference of 0.0%), Palestinian (49.0%, a difference of 0.0%), Luxembourger (48.9%, a difference of 0.070%), British (48.9%, a difference of 0.13%), and Afghan (48.9%, a difference of 0.18%).
| Demographics | Rating | Rank | Associate's Degree |
| Syrians | 96.7 /100 | #107 | Exceptional 49.3% |
| Jordanians | 96.6 /100 | #108 | Exceptional 49.2% |
| Immigrants | Morocco | 96.3 /100 | #109 | Exceptional 49.2% |
| Austrians | 95.8 /100 | #110 | Exceptional 49.1% |
| Immigrants | Venezuela | 95.8 /100 | #111 | Exceptional 49.1% |
| Immigrants | Chile | 95.3 /100 | #112 | Exceptional 49.0% |
| Palestinians | 95.3 /100 | #113 | Exceptional 49.0% |
| Arabs | 95.3 /100 | #114 | Exceptional 49.0% |
| Luxembourgers | 95.1 /100 | #115 | Exceptional 48.9% |
| British | 95.0 /100 | #116 | Exceptional 48.9% |
| Afghans | 94.8 /100 | #117 | Exceptional 48.9% |
| Albanians | 94.7 /100 | #118 | Exceptional 48.8% |
| Lebanese | 94.6 /100 | #119 | Exceptional 48.8% |
| Alsatians | 94.6 /100 | #120 | Exceptional 48.8% |
| Ugandans | 93.9 /100 | #121 | Exceptional 48.7% |