Ecuadorian vs Arab Associate's Degree
COMPARE
Ecuadorian
Arab
Associate's Degree
Associate's Degree Comparison
Ecuadorians
Arabs
43.0%
ASSOCIATE'S DEGREE
2.0/ 100
METRIC RATING
235th/ 347
METRIC RANK
49.0%
ASSOCIATE'S DEGREE
95.3/ 100
METRIC RATING
114th/ 347
METRIC RANK
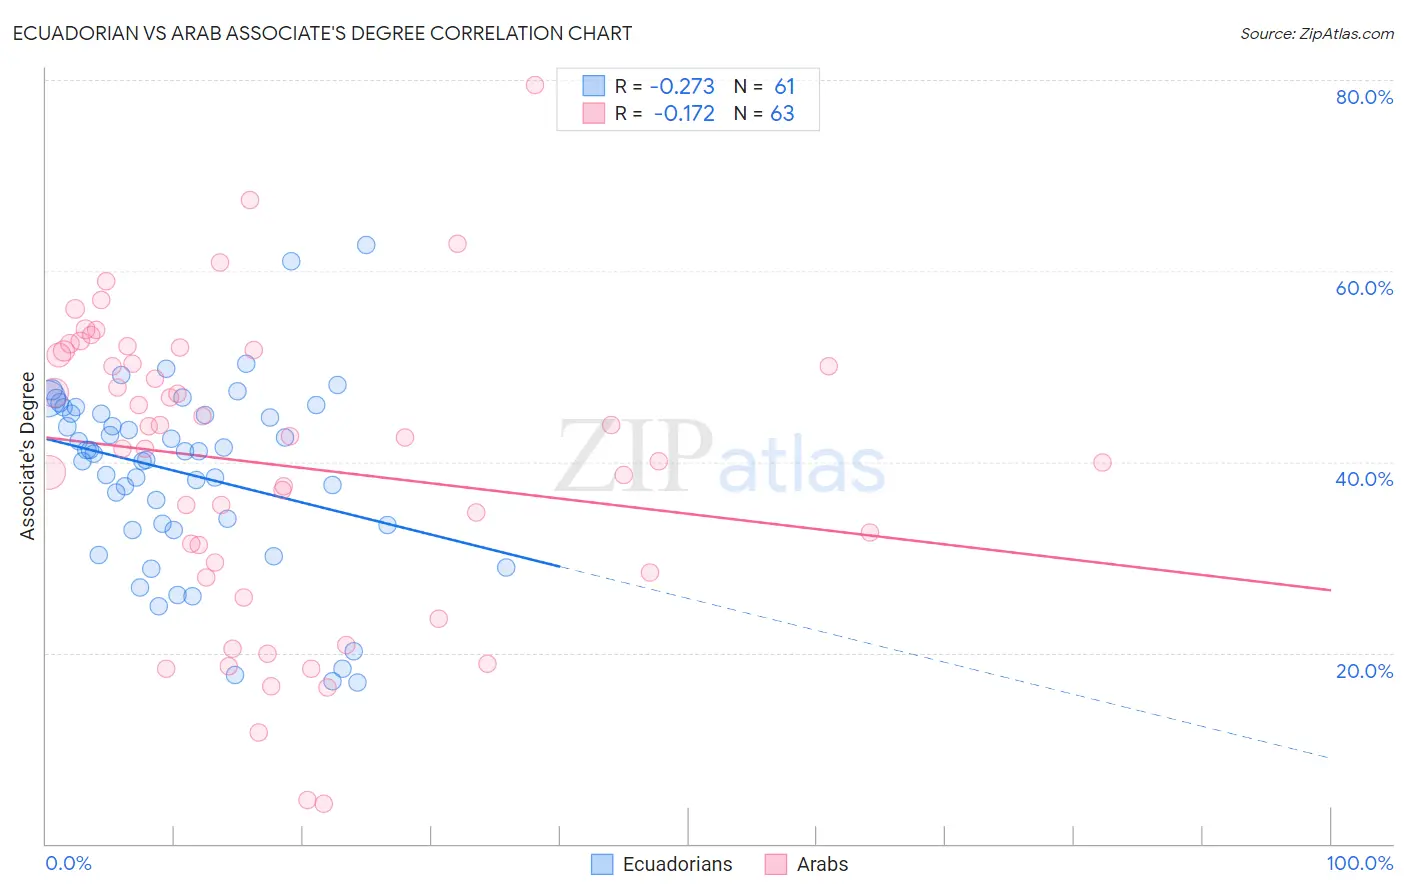
Ecuadorian vs Arab Associate's Degree Correlation Chart
The statistical analysis conducted on geographies consisting of 317,844,783 people shows a weak negative correlation between the proportion of Ecuadorians and percentage of population with at least associate's degree education in the United States with a correlation coefficient (R) of -0.273 and weighted average of 43.0%. Similarly, the statistical analysis conducted on geographies consisting of 486,836,450 people shows a poor negative correlation between the proportion of Arabs and percentage of population with at least associate's degree education in the United States with a correlation coefficient (R) of -0.172 and weighted average of 49.0%, a difference of 13.9%.
Associate's Degree Correlation Summary
| Measurement | Ecuadorian | Arab |
| Minimum | 16.9% | 4.3% |
| Maximum | 62.8% | 79.5% |
| Range | 45.8% | 75.3% |
| Mean | 38.8% | 39.7% |
| Median | 41.1% | 42.6% |
| Interquartile 25% (IQ1) | 33.1% | 28.4% |
| Interquartile 75% (IQ3) | 45.4% | 51.6% |
| Interquartile Range (IQR) | 12.3% | 23.3% |
| Standard Deviation (Sample) | 9.7% | 15.6% |
| Standard Deviation (Population) | 9.7% | 15.5% |
Similar Demographics by Associate's Degree
Demographics Similar to Ecuadorians by Associate's Degree
In terms of associate's degree, the demographic groups most similar to Ecuadorians are Immigrants from St. Vincent and the Grenadines (42.9%, a difference of 0.080%), Tlingit-Haida (43.0%, a difference of 0.090%), Nonimmigrants (42.9%, a difference of 0.10%), Tongan (43.0%, a difference of 0.19%), and Native Hawaiian (43.1%, a difference of 0.35%).
| Demographics | Rating | Rank | Associate's Degree |
| Hmong | 3.2 /100 | #228 | Tragic 43.4% |
| Immigrants | Trinidad and Tobago | 3.0 /100 | #229 | Tragic 43.3% |
| Immigrants | Barbados | 2.9 /100 | #230 | Tragic 43.3% |
| Liberians | 2.9 /100 | #231 | Tragic 43.3% |
| Native Hawaiians | 2.3 /100 | #232 | Tragic 43.1% |
| Tongans | 2.2 /100 | #233 | Tragic 43.0% |
| Tlingit-Haida | 2.1 /100 | #234 | Tragic 43.0% |
| Ecuadorians | 2.0 /100 | #235 | Tragic 43.0% |
| Immigrants | St. Vincent and the Grenadines | 1.9 /100 | #236 | Tragic 42.9% |
| Immigrants | Nonimmigrants | 1.9 /100 | #237 | Tragic 42.9% |
| Iroquois | 1.7 /100 | #238 | Tragic 42.8% |
| Immigrants | Grenada | 1.3 /100 | #239 | Tragic 42.6% |
| Cree | 1.2 /100 | #240 | Tragic 42.5% |
| British West Indians | 1.0 /100 | #241 | Tragic 42.4% |
| Immigrants | West Indies | 1.0 /100 | #242 | Tragic 42.4% |
Demographics Similar to Arabs by Associate's Degree
In terms of associate's degree, the demographic groups most similar to Arabs are Immigrants from Chile (49.0%, a difference of 0.0%), Palestinian (49.0%, a difference of 0.0%), Luxembourger (48.9%, a difference of 0.070%), British (48.9%, a difference of 0.13%), and Afghan (48.9%, a difference of 0.18%).
| Demographics | Rating | Rank | Associate's Degree |
| Syrians | 96.7 /100 | #107 | Exceptional 49.3% |
| Jordanians | 96.6 /100 | #108 | Exceptional 49.2% |
| Immigrants | Morocco | 96.3 /100 | #109 | Exceptional 49.2% |
| Austrians | 95.8 /100 | #110 | Exceptional 49.1% |
| Immigrants | Venezuela | 95.8 /100 | #111 | Exceptional 49.1% |
| Immigrants | Chile | 95.3 /100 | #112 | Exceptional 49.0% |
| Palestinians | 95.3 /100 | #113 | Exceptional 49.0% |
| Arabs | 95.3 /100 | #114 | Exceptional 49.0% |
| Luxembourgers | 95.1 /100 | #115 | Exceptional 48.9% |
| British | 95.0 /100 | #116 | Exceptional 48.9% |
| Afghans | 94.8 /100 | #117 | Exceptional 48.9% |
| Albanians | 94.7 /100 | #118 | Exceptional 48.8% |
| Lebanese | 94.6 /100 | #119 | Exceptional 48.8% |
| Alsatians | 94.6 /100 | #120 | Exceptional 48.8% |
| Ugandans | 93.9 /100 | #121 | Exceptional 48.7% |