Samoan vs Puget Sound Salish 9th Grade
COMPARE
Samoan
Puget Sound Salish
9th Grade
9th Grade Comparison
Samoans
Puget Sound Salish
94.6%
9TH GRADE
17.3/ 100
METRIC RATING
206th/ 347
METRIC RANK
95.7%
9TH GRADE
99.2/ 100
METRIC RATING
82nd/ 347
METRIC RANK
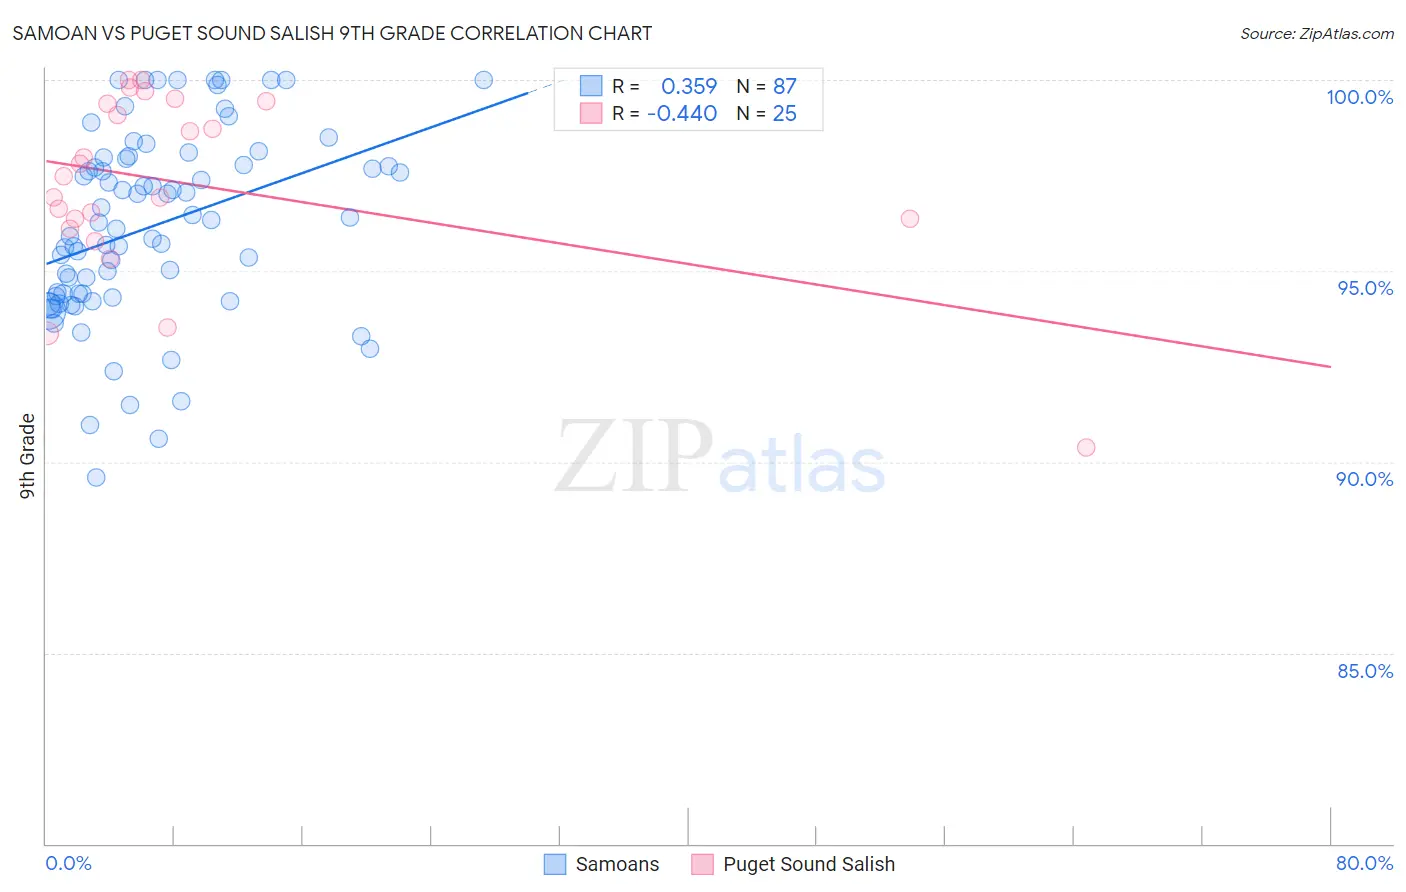
Samoan vs Puget Sound Salish 9th Grade Correlation Chart
The statistical analysis conducted on geographies consisting of 225,201,909 people shows a mild positive correlation between the proportion of Samoans and percentage of population with at least 9th grade education in the United States with a correlation coefficient (R) of 0.359 and weighted average of 94.6%. Similarly, the statistical analysis conducted on geographies consisting of 46,155,775 people shows a moderate negative correlation between the proportion of Puget Sound Salish and percentage of population with at least 9th grade education in the United States with a correlation coefficient (R) of -0.440 and weighted average of 95.7%, a difference of 1.2%.
9th Grade Correlation Summary
| Measurement | Samoan | Puget Sound Salish |
| Minimum | 89.6% | 90.4% |
| Maximum | 100.0% | 100.0% |
| Range | 10.4% | 9.6% |
| Mean | 96.2% | 97.3% |
| Median | 96.3% | 97.5% |
| Interquartile 25% (IQ1) | 94.3% | 96.2% |
| Interquartile 75% (IQ3) | 97.9% | 99.4% |
| Interquartile Range (IQR) | 3.6% | 3.2% |
| Standard Deviation (Sample) | 2.4% | 2.4% |
| Standard Deviation (Population) | 2.4% | 2.3% |
Similar Demographics by 9th Grade
Demographics Similar to Samoans by 9th Grade
In terms of 9th grade, the demographic groups most similar to Samoans are Immigrants from Sudan (94.6%, a difference of 0.0%), Immigrants from Morocco (94.6%, a difference of 0.010%), Immigrants from Pakistan (94.6%, a difference of 0.020%), Immigrants from Eastern Asia (94.6%, a difference of 0.030%), and Immigrants from Bahamas (94.6%, a difference of 0.030%).
| Demographics | Rating | Rank | 9th Grade |
| Laotians | 21.0 /100 | #199 | Fair 94.6% |
| Immigrants | Zaire | 20.6 /100 | #200 | Fair 94.6% |
| Blacks/African Americans | 20.5 /100 | #201 | Fair 94.6% |
| Immigrants | Eastern Asia | 19.8 /100 | #202 | Poor 94.6% |
| Immigrants | Bahamas | 19.8 /100 | #203 | Poor 94.6% |
| Moroccans | 19.6 /100 | #204 | Poor 94.6% |
| Immigrants | Sudan | 17.6 /100 | #205 | Poor 94.6% |
| Samoans | 17.3 /100 | #206 | Poor 94.6% |
| Immigrants | Morocco | 16.3 /100 | #207 | Poor 94.6% |
| Immigrants | Pakistan | 15.5 /100 | #208 | Poor 94.6% |
| Comanche | 14.9 /100 | #209 | Poor 94.6% |
| Immigrants | Chile | 13.4 /100 | #210 | Poor 94.5% |
| Immigrants | Indonesia | 12.3 /100 | #211 | Poor 94.5% |
| Immigrants | Malaysia | 12.2 /100 | #212 | Poor 94.5% |
| Immigrants | Oceania | 12.1 /100 | #213 | Poor 94.5% |
Demographics Similar to Puget Sound Salish by 9th Grade
In terms of 9th grade, the demographic groups most similar to Puget Sound Salish are Bhutanese (95.7%, a difference of 0.0%), Arapaho (95.7%, a difference of 0.0%), Romanian (95.7%, a difference of 0.020%), Swiss (95.7%, a difference of 0.020%), and Immigrants from Denmark (95.7%, a difference of 0.020%).
| Demographics | Rating | Rank | 9th Grade |
| Inupiat | 99.5 /100 | #75 | Exceptional 95.8% |
| Immigrants | Sweden | 99.5 /100 | #76 | Exceptional 95.8% |
| Whites/Caucasians | 99.4 /100 | #77 | Exceptional 95.8% |
| Immigrants | South Africa | 99.4 /100 | #78 | Exceptional 95.8% |
| Romanians | 99.3 /100 | #79 | Exceptional 95.7% |
| Bhutanese | 99.3 /100 | #80 | Exceptional 95.7% |
| Arapaho | 99.3 /100 | #81 | Exceptional 95.7% |
| Puget Sound Salish | 99.2 /100 | #82 | Exceptional 95.7% |
| Swiss | 99.2 /100 | #83 | Exceptional 95.7% |
| Immigrants | Denmark | 99.1 /100 | #84 | Exceptional 95.7% |
| Icelanders | 99.1 /100 | #85 | Exceptional 95.7% |
| Immigrants | Western Europe | 99.1 /100 | #86 | Exceptional 95.7% |
| Okinawans | 99.0 /100 | #87 | Exceptional 95.7% |
| Immigrants | Czechoslovakia | 98.9 /100 | #88 | Exceptional 95.7% |
| Yugoslavians | 98.9 /100 | #89 | Exceptional 95.7% |