Samoan vs Immigrants from Europe 9th Grade
COMPARE
Samoan
Immigrants from Europe
9th Grade
9th Grade Comparison
Samoans
Immigrants from Europe
94.6%
9TH GRADE
17.3/ 100
METRIC RATING
206th/ 347
METRIC RANK
95.4%
9TH GRADE
95.7/ 100
METRIC RATING
116th/ 347
METRIC RANK
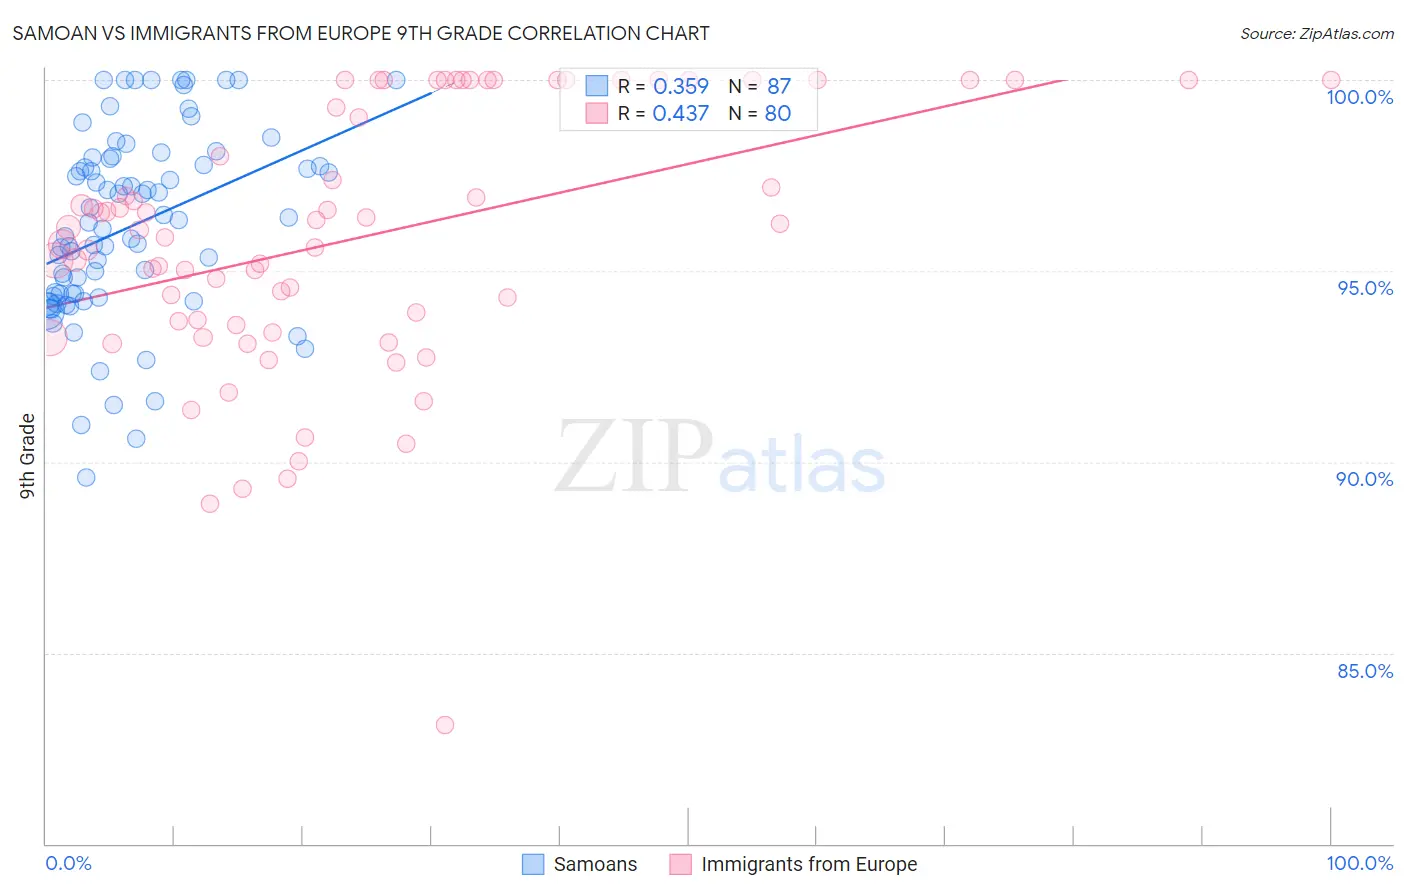
Samoan vs Immigrants from Europe 9th Grade Correlation Chart
The statistical analysis conducted on geographies consisting of 225,201,909 people shows a mild positive correlation between the proportion of Samoans and percentage of population with at least 9th grade education in the United States with a correlation coefficient (R) of 0.359 and weighted average of 94.6%. Similarly, the statistical analysis conducted on geographies consisting of 547,425,973 people shows a moderate positive correlation between the proportion of Immigrants from Europe and percentage of population with at least 9th grade education in the United States with a correlation coefficient (R) of 0.437 and weighted average of 95.4%, a difference of 0.86%.
9th Grade Correlation Summary
| Measurement | Samoan | Immigrants from Europe |
| Minimum | 89.6% | 83.1% |
| Maximum | 100.0% | 100.0% |
| Range | 10.4% | 16.9% |
| Mean | 96.2% | 95.9% |
| Median | 96.3% | 96.1% |
| Interquartile 25% (IQ1) | 94.3% | 93.6% |
| Interquartile 75% (IQ3) | 97.9% | 100.0% |
| Interquartile Range (IQR) | 3.6% | 6.4% |
| Standard Deviation (Sample) | 2.4% | 3.5% |
| Standard Deviation (Population) | 2.4% | 3.4% |
Similar Demographics by 9th Grade
Demographics Similar to Samoans by 9th Grade
In terms of 9th grade, the demographic groups most similar to Samoans are Immigrants from Sudan (94.6%, a difference of 0.0%), Immigrants from Morocco (94.6%, a difference of 0.010%), Immigrants from Pakistan (94.6%, a difference of 0.020%), Immigrants from Eastern Asia (94.6%, a difference of 0.030%), and Immigrants from Bahamas (94.6%, a difference of 0.030%).
| Demographics | Rating | Rank | 9th Grade |
| Laotians | 21.0 /100 | #199 | Fair 94.6% |
| Immigrants | Zaire | 20.6 /100 | #200 | Fair 94.6% |
| Blacks/African Americans | 20.5 /100 | #201 | Fair 94.6% |
| Immigrants | Eastern Asia | 19.8 /100 | #202 | Poor 94.6% |
| Immigrants | Bahamas | 19.8 /100 | #203 | Poor 94.6% |
| Moroccans | 19.6 /100 | #204 | Poor 94.6% |
| Immigrants | Sudan | 17.6 /100 | #205 | Poor 94.6% |
| Samoans | 17.3 /100 | #206 | Poor 94.6% |
| Immigrants | Morocco | 16.3 /100 | #207 | Poor 94.6% |
| Immigrants | Pakistan | 15.5 /100 | #208 | Poor 94.6% |
| Comanche | 14.9 /100 | #209 | Poor 94.6% |
| Immigrants | Chile | 13.4 /100 | #210 | Poor 94.5% |
| Immigrants | Indonesia | 12.3 /100 | #211 | Poor 94.5% |
| Immigrants | Malaysia | 12.2 /100 | #212 | Poor 94.5% |
| Immigrants | Oceania | 12.1 /100 | #213 | Poor 94.5% |
Demographics Similar to Immigrants from Europe by 9th Grade
In terms of 9th grade, the demographic groups most similar to Immigrants from Europe are Immigrants from Romania (95.4%, a difference of 0.0%), Immigrants from Turkey (95.4%, a difference of 0.0%), Soviet Union (95.4%, a difference of 0.0%), Cambodian (95.4%, a difference of 0.0%), and Burmese (95.4%, a difference of 0.010%).
| Demographics | Rating | Rank | 9th Grade |
| Osage | 96.8 /100 | #109 | Exceptional 95.5% |
| Immigrants | Bulgaria | 96.7 /100 | #110 | Exceptional 95.5% |
| Cherokee | 96.3 /100 | #111 | Exceptional 95.4% |
| Immigrants | Croatia | 96.2 /100 | #112 | Exceptional 95.4% |
| Iroquois | 96.2 /100 | #113 | Exceptional 95.4% |
| German Russians | 96.1 /100 | #114 | Exceptional 95.4% |
| Burmese | 96.0 /100 | #115 | Exceptional 95.4% |
| Immigrants | Europe | 95.7 /100 | #116 | Exceptional 95.4% |
| Immigrants | Romania | 95.6 /100 | #117 | Exceptional 95.4% |
| Immigrants | Turkey | 95.6 /100 | #118 | Exceptional 95.4% |
| Soviet Union | 95.6 /100 | #119 | Exceptional 95.4% |
| Cambodians | 95.6 /100 | #120 | Exceptional 95.4% |
| Cree | 95.5 /100 | #121 | Exceptional 95.4% |
| Immigrants | Kuwait | 95.5 /100 | #122 | Exceptional 95.4% |
| Kiowa | 95.3 /100 | #123 | Exceptional 95.4% |