Ethiopian vs Immigrants from Grenada 9th Grade
COMPARE
Ethiopian
Immigrants from Grenada
9th Grade
9th Grade Comparison
Ethiopians
Immigrants from Grenada
94.4%
9TH GRADE
5.4/ 100
METRIC RATING
225th/ 347
METRIC RANK
93.0%
9TH GRADE
0.0/ 100
METRIC RATING
299th/ 347
METRIC RANK
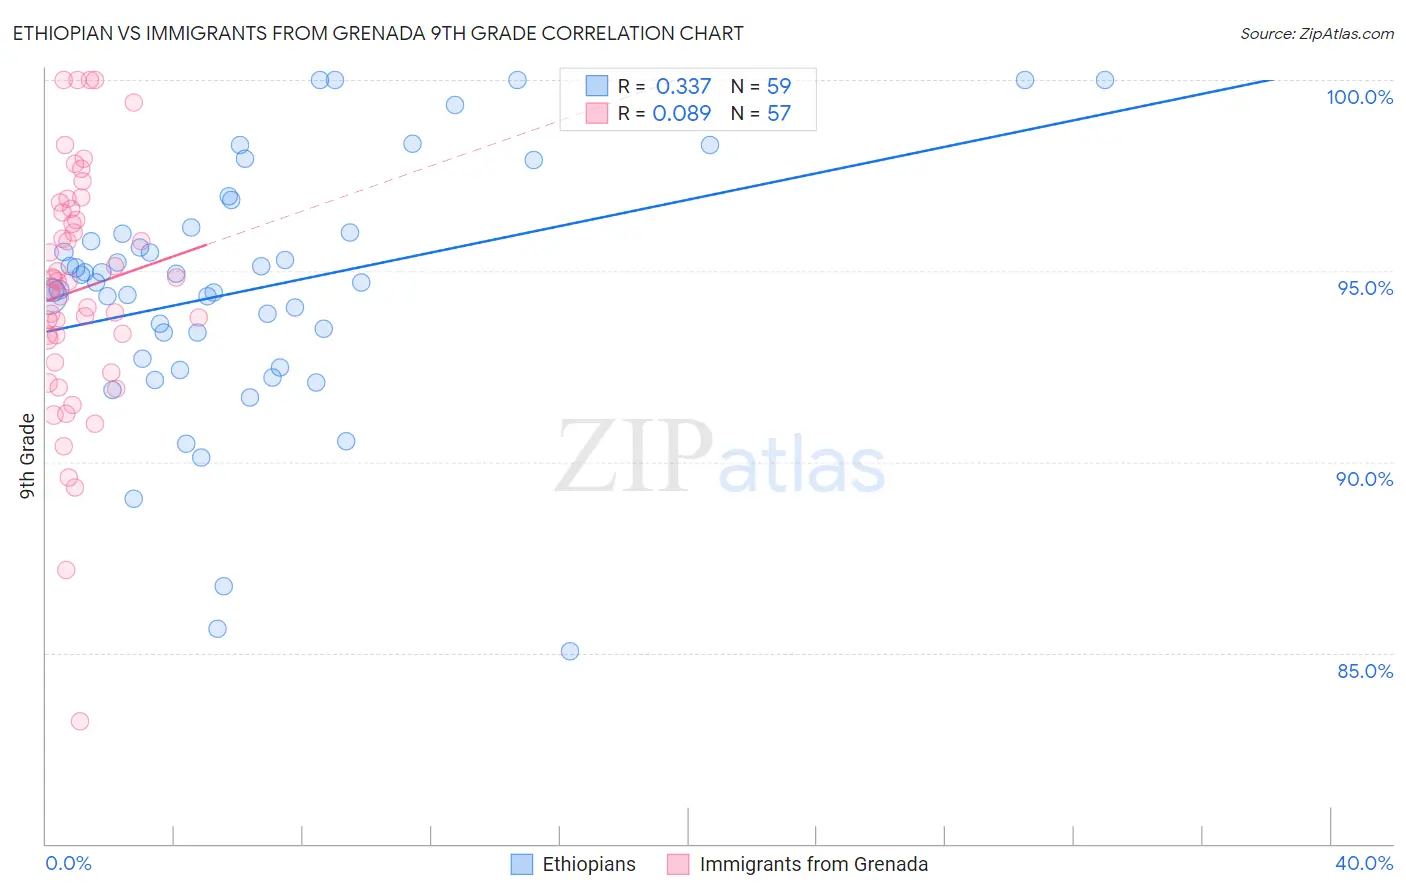
Ethiopian vs Immigrants from Grenada 9th Grade Correlation Chart
The statistical analysis conducted on geographies consisting of 223,135,094 people shows a mild positive correlation between the proportion of Ethiopians and percentage of population with at least 9th grade education in the United States with a correlation coefficient (R) of 0.337 and weighted average of 94.4%. Similarly, the statistical analysis conducted on geographies consisting of 67,193,627 people shows a slight positive correlation between the proportion of Immigrants from Grenada and percentage of population with at least 9th grade education in the United States with a correlation coefficient (R) of 0.089 and weighted average of 93.0%, a difference of 1.4%.
9th Grade Correlation Summary
| Measurement | Ethiopian | Immigrants from Grenada |
| Minimum | 85.0% | 83.2% |
| Maximum | 100.0% | 100.0% |
| Range | 15.0% | 16.8% |
| Mean | 94.5% | 94.5% |
| Median | 94.7% | 94.7% |
| Interquartile 25% (IQ1) | 92.7% | 92.9% |
| Interquartile 75% (IQ3) | 96.0% | 96.6% |
| Interquartile Range (IQR) | 3.3% | 3.7% |
| Standard Deviation (Sample) | 3.3% | 3.2% |
| Standard Deviation (Population) | 3.3% | 3.2% |
Similar Demographics by 9th Grade
Demographics Similar to Ethiopians by 9th Grade
In terms of 9th grade, the demographic groups most similar to Ethiopians are Subsaharan African (94.4%, a difference of 0.0%), Tongan (94.4%, a difference of 0.020%), Immigrants from Sierra Leone (94.4%, a difference of 0.020%), Lumbee (94.4%, a difference of 0.030%), and Immigrants from Southern Europe (94.3%, a difference of 0.030%).
| Demographics | Rating | Rank | 9th Grade |
| Portuguese | 9.2 /100 | #218 | Tragic 94.5% |
| Africans | 9.0 /100 | #219 | Tragic 94.5% |
| Indians (Asian) | 8.6 /100 | #220 | Tragic 94.5% |
| Immigrants | Eastern Africa | 8.2 /100 | #221 | Tragic 94.5% |
| Immigrants | Asia | 7.7 /100 | #222 | Tragic 94.4% |
| Bahamians | 7.0 /100 | #223 | Tragic 94.4% |
| Tongans | 6.0 /100 | #224 | Tragic 94.4% |
| Ethiopians | 5.4 /100 | #225 | Tragic 94.4% |
| Sub-Saharan Africans | 5.4 /100 | #226 | Tragic 94.4% |
| Immigrants | Sierra Leone | 4.8 /100 | #227 | Tragic 94.4% |
| Lumbee | 4.7 /100 | #228 | Tragic 94.4% |
| Immigrants | Southern Europe | 4.5 /100 | #229 | Tragic 94.3% |
| Apache | 4.2 /100 | #230 | Tragic 94.3% |
| Immigrants | Panama | 4.0 /100 | #231 | Tragic 94.3% |
| Immigrants | Africa | 3.9 /100 | #232 | Tragic 94.3% |
Demographics Similar to Immigrants from Grenada by 9th Grade
In terms of 9th grade, the demographic groups most similar to Immigrants from Grenada are Haitian (93.1%, a difference of 0.060%), Fijian (93.1%, a difference of 0.090%), Immigrants from Burma/Myanmar (93.1%, a difference of 0.12%), Indonesian (93.1%, a difference of 0.12%), and Yaqui (92.9%, a difference of 0.13%).
| Demographics | Rating | Rank | 9th Grade |
| Immigrants | Laos | 0.0 /100 | #292 | Tragic 93.2% |
| Sri Lankans | 0.0 /100 | #293 | Tragic 93.2% |
| Cubans | 0.0 /100 | #294 | Tragic 93.2% |
| Immigrants | Burma/Myanmar | 0.0 /100 | #295 | Tragic 93.1% |
| Indonesians | 0.0 /100 | #296 | Tragic 93.1% |
| Fijians | 0.0 /100 | #297 | Tragic 93.1% |
| Haitians | 0.0 /100 | #298 | Tragic 93.1% |
| Immigrants | Grenada | 0.0 /100 | #299 | Tragic 93.0% |
| Yaqui | 0.0 /100 | #300 | Tragic 92.9% |
| Immigrants | Haiti | 0.0 /100 | #301 | Tragic 92.7% |
| Immigrants | Dominica | 0.0 /100 | #302 | Tragic 92.7% |
| Guyanese | 0.0 /100 | #303 | Tragic 92.7% |
| Tohono O'odham | 0.0 /100 | #304 | Tragic 92.6% |
| Japanese | 0.0 /100 | #305 | Tragic 92.6% |
| Immigrants | Vietnam | 0.0 /100 | #306 | Tragic 92.6% |