Samoan vs Japanese No Schooling Completed
COMPARE
Samoan
Japanese
No Schooling Completed
No Schooling Completed Comparison
Samoans
Japanese
2.3%
NO SCHOOLING COMPLETED
8.2/ 100
METRIC RATING
214th/ 347
METRIC RANK
3.3%
NO SCHOOLING COMPLETED
0.0/ 100
METRIC RATING
331st/ 347
METRIC RANK
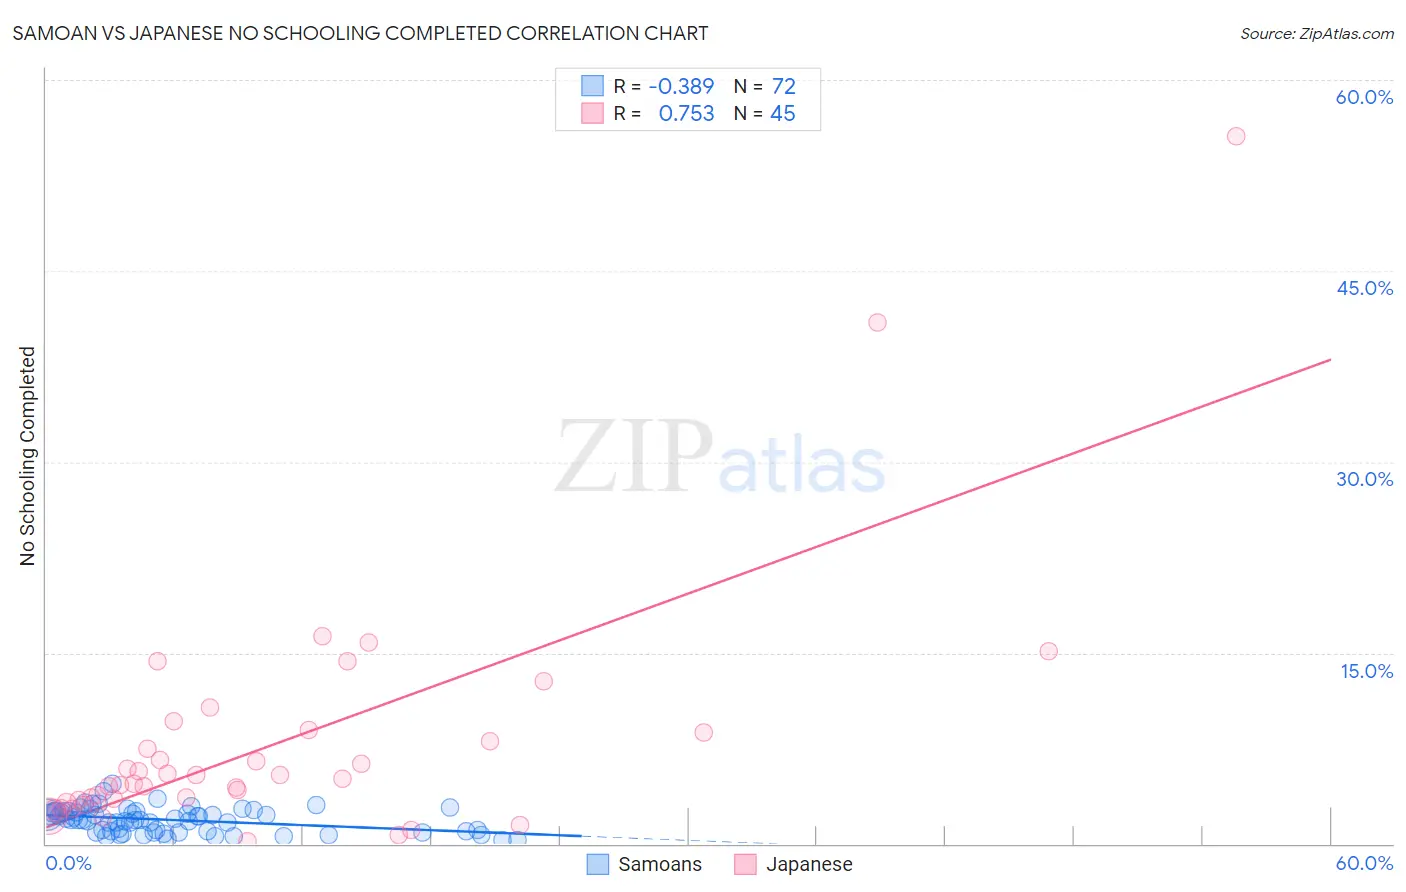
Samoan vs Japanese No Schooling Completed Correlation Chart
The statistical analysis conducted on geographies consisting of 223,861,902 people shows a mild negative correlation between the proportion of Samoans and percentage of population with no schooling in the United States with a correlation coefficient (R) of -0.389 and weighted average of 2.3%. Similarly, the statistical analysis conducted on geographies consisting of 248,181,400 people shows a strong positive correlation between the proportion of Japanese and percentage of population with no schooling in the United States with a correlation coefficient (R) of 0.753 and weighted average of 3.3%, a difference of 48.0%.
No Schooling Completed Correlation Summary
| Measurement | Samoan | Japanese |
| Minimum | 0.26% | 0.20% |
| Maximum | 4.7% | 55.6% |
| Range | 4.5% | 55.4% |
| Mean | 1.9% | 8.0% |
| Median | 1.9% | 5.1% |
| Interquartile 25% (IQ1) | 0.97% | 3.3% |
| Interquartile 75% (IQ3) | 2.5% | 8.8% |
| Interquartile Range (IQR) | 1.6% | 5.5% |
| Standard Deviation (Sample) | 0.95% | 9.8% |
| Standard Deviation (Population) | 0.95% | 9.7% |
Similar Demographics by No Schooling Completed
Demographics Similar to Samoans by No Schooling Completed
In terms of no schooling completed, the demographic groups most similar to Samoans are Ute (2.3%, a difference of 0.040%), Immigrants from Morocco (2.3%, a difference of 0.23%), Immigrants from Panama (2.3%, a difference of 0.24%), Immigrants from Zaire (2.3%, a difference of 0.43%), and Tongan (2.3%, a difference of 0.63%).
| Demographics | Rating | Rank | No Schooling Completed |
| South American Indians | 11.0 /100 | #207 | Poor 2.2% |
| Uruguayans | 11.0 /100 | #208 | Poor 2.2% |
| Immigrants | Oceania | 10.2 /100 | #209 | Poor 2.2% |
| Natives/Alaskans | 10.0 /100 | #210 | Tragic 2.2% |
| Immigrants | Panama | 8.8 /100 | #211 | Tragic 2.3% |
| Immigrants | Morocco | 8.7 /100 | #212 | Tragic 2.3% |
| Ute | 8.2 /100 | #213 | Tragic 2.3% |
| Samoans | 8.2 /100 | #214 | Tragic 2.3% |
| Immigrants | Zaire | 7.2 /100 | #215 | Tragic 2.3% |
| Tongans | 6.8 /100 | #216 | Tragic 2.3% |
| Immigrants | Syria | 6.6 /100 | #217 | Tragic 2.3% |
| Immigrants | Nepal | 6.4 /100 | #218 | Tragic 2.3% |
| Senegalese | 5.6 /100 | #219 | Tragic 2.3% |
| Immigrants | Costa Rica | 5.1 /100 | #220 | Tragic 2.3% |
| Immigrants | Sudan | 5.0 /100 | #221 | Tragic 2.3% |
Demographics Similar to Japanese by No Schooling Completed
In terms of no schooling completed, the demographic groups most similar to Japanese are Immigrants from Armenia (3.3%, a difference of 0.030%), Immigrants from Vietnam (3.3%, a difference of 0.45%), Central American (3.4%, a difference of 1.5%), Mexican (3.3%, a difference of 1.5%), and Immigrants from Dominican Republic (3.4%, a difference of 1.6%).
| Demographics | Rating | Rank | No Schooling Completed |
| Mexican American Indians | 0.0 /100 | #324 | Tragic 3.2% |
| Dominicans | 0.0 /100 | #325 | Tragic 3.2% |
| Indonesians | 0.0 /100 | #326 | Tragic 3.2% |
| Immigrants | Latin America | 0.0 /100 | #327 | Tragic 3.3% |
| Mexicans | 0.0 /100 | #328 | Tragic 3.3% |
| Immigrants | Vietnam | 0.0 /100 | #329 | Tragic 3.3% |
| Immigrants | Armenia | 0.0 /100 | #330 | Tragic 3.3% |
| Japanese | 0.0 /100 | #331 | Tragic 3.3% |
| Central Americans | 0.0 /100 | #332 | Tragic 3.4% |
| Immigrants | Dominican Republic | 0.0 /100 | #333 | Tragic 3.4% |
| Guatemalans | 0.0 /100 | #334 | Tragic 3.5% |
| Immigrants | Cambodia | 0.0 /100 | #335 | Tragic 3.5% |
| Immigrants | Fiji | 0.0 /100 | #336 | Tragic 3.5% |
| Immigrants | Cabo Verde | 0.0 /100 | #337 | Tragic 3.5% |
| Bangladeshis | 0.0 /100 | #338 | Tragic 3.5% |