Immigrants from Caribbean vs Immigrants from Eastern Asia No Schooling Completed
COMPARE
Immigrants from Caribbean
Immigrants from Eastern Asia
No Schooling Completed
No Schooling Completed Comparison
Immigrants from Caribbean
Immigrants from Eastern Asia
2.9%
NO SCHOOLING COMPLETED
0.0/ 100
METRIC RATING
302nd/ 347
METRIC RANK
2.4%
NO SCHOOLING COMPLETED
2.0/ 100
METRIC RATING
237th/ 347
METRIC RANK
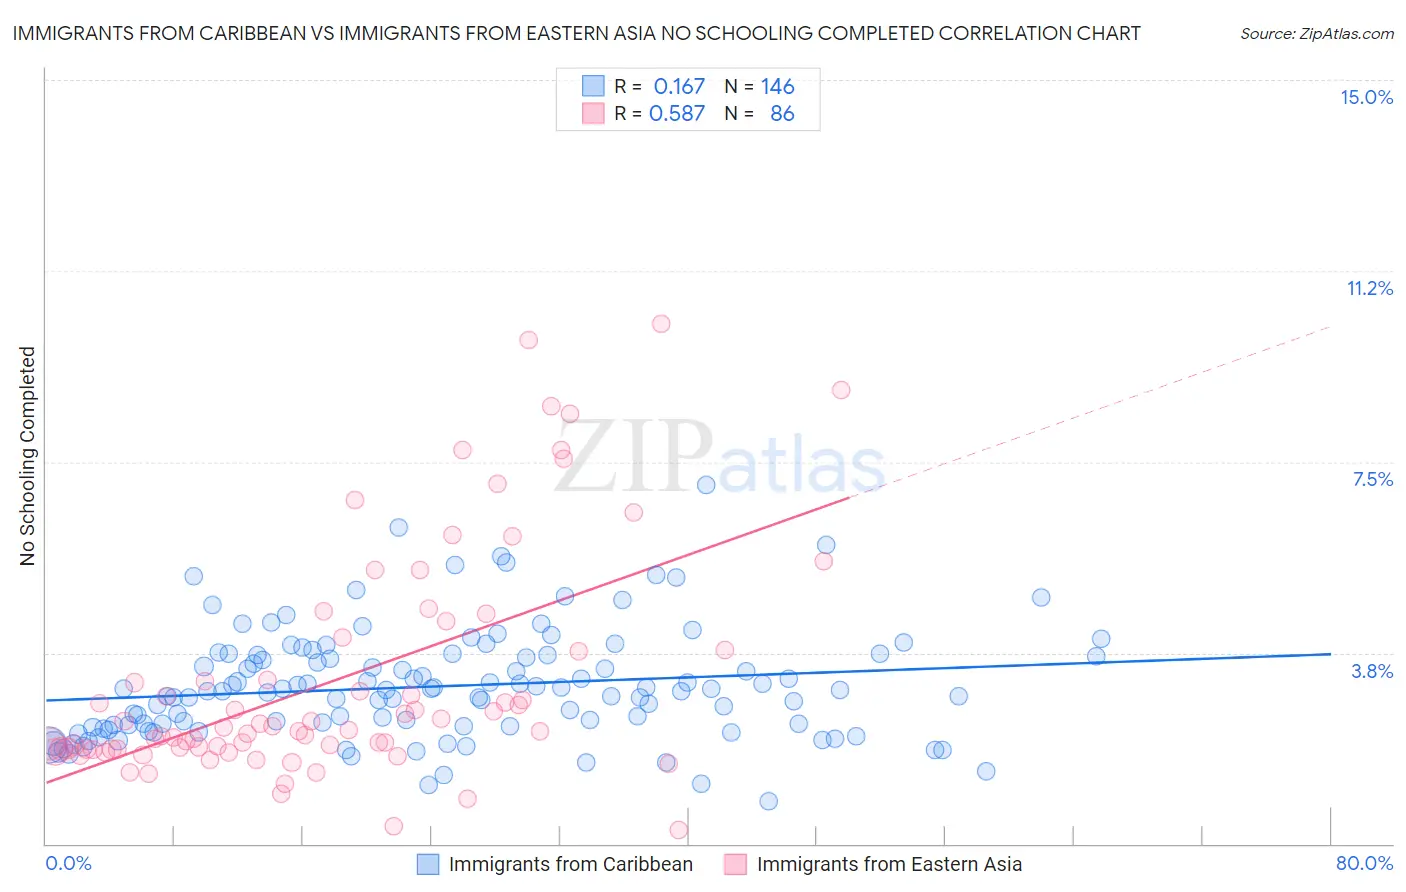
Immigrants from Caribbean vs Immigrants from Eastern Asia No Schooling Completed Correlation Chart
The statistical analysis conducted on geographies consisting of 444,825,706 people shows a poor positive correlation between the proportion of Immigrants from Caribbean and percentage of population with no schooling in the United States with a correlation coefficient (R) of 0.167 and weighted average of 2.9%. Similarly, the statistical analysis conducted on geographies consisting of 491,002,853 people shows a substantial positive correlation between the proportion of Immigrants from Eastern Asia and percentage of population with no schooling in the United States with a correlation coefficient (R) of 0.587 and weighted average of 2.4%, a difference of 23.0%.
No Schooling Completed Correlation Summary
| Measurement | Immigrants from Caribbean | Immigrants from Eastern Asia |
| Minimum | 0.82% | 0.26% |
| Maximum | 7.0% | 10.2% |
| Range | 6.2% | 10.0% |
| Mean | 3.1% | 3.2% |
| Median | 3.0% | 2.3% |
| Interquartile 25% (IQ1) | 2.3% | 1.9% |
| Interquartile 75% (IQ3) | 3.7% | 3.8% |
| Interquartile Range (IQR) | 1.4% | 1.9% |
| Standard Deviation (Sample) | 1.1% | 2.2% |
| Standard Deviation (Population) | 1.1% | 2.2% |
Similar Demographics by No Schooling Completed
Demographics Similar to Immigrants from Caribbean by No Schooling Completed
In terms of no schooling completed, the demographic groups most similar to Immigrants from Caribbean are Immigrants from South Eastern Asia (2.9%, a difference of 0.37%), Somali (2.9%, a difference of 0.99%), Nicaraguan (2.9%, a difference of 1.2%), Ecuadorian (3.0%, a difference of 1.7%), and Haitian (2.9%, a difference of 1.9%).
| Demographics | Rating | Rank | No Schooling Completed |
| Houma | 0.0 /100 | #295 | Tragic 2.8% |
| Immigrants | Immigrants | 0.0 /100 | #296 | Tragic 2.8% |
| Immigrants | Cuba | 0.0 /100 | #297 | Tragic 2.8% |
| Immigrants | Dominica | 0.0 /100 | #298 | Tragic 2.8% |
| Central American Indians | 0.0 /100 | #299 | Tragic 2.8% |
| Haitians | 0.0 /100 | #300 | Tragic 2.9% |
| Immigrants | South Eastern Asia | 0.0 /100 | #301 | Tragic 2.9% |
| Immigrants | Caribbean | 0.0 /100 | #302 | Tragic 2.9% |
| Somalis | 0.0 /100 | #303 | Tragic 2.9% |
| Nicaraguans | 0.0 /100 | #304 | Tragic 2.9% |
| Ecuadorians | 0.0 /100 | #305 | Tragic 3.0% |
| Belizeans | 0.0 /100 | #306 | Tragic 3.0% |
| Immigrants | Haiti | 0.0 /100 | #307 | Tragic 3.0% |
| Immigrants | Somalia | 0.0 /100 | #308 | Tragic 3.0% |
| Hispanics or Latinos | 0.0 /100 | #309 | Tragic 3.0% |
Demographics Similar to Immigrants from Eastern Asia by No Schooling Completed
In terms of no schooling completed, the demographic groups most similar to Immigrants from Eastern Asia are Iraqi (2.4%, a difference of 0.20%), Paiute (2.4%, a difference of 0.21%), Liberian (2.4%, a difference of 0.33%), Immigrants from Senegal (2.4%, a difference of 0.56%), and Korean (2.4%, a difference of 0.62%).
| Demographics | Rating | Rank | No Schooling Completed |
| Puerto Ricans | 3.4 /100 | #230 | Tragic 2.3% |
| Immigrants | Uruguay | 3.4 /100 | #231 | Tragic 2.3% |
| Colombians | 3.2 /100 | #232 | Tragic 2.3% |
| Immigrants | Malaysia | 2.8 /100 | #233 | Tragic 2.3% |
| Nigerians | 2.6 /100 | #234 | Tragic 2.3% |
| Immigrants | Western Asia | 2.6 /100 | #235 | Tragic 2.3% |
| Iraqis | 2.2 /100 | #236 | Tragic 2.4% |
| Immigrants | Eastern Asia | 2.0 /100 | #237 | Tragic 2.4% |
| Paiute | 1.9 /100 | #238 | Tragic 2.4% |
| Liberians | 1.8 /100 | #239 | Tragic 2.4% |
| Immigrants | Senegal | 1.7 /100 | #240 | Tragic 2.4% |
| Koreans | 1.7 /100 | #241 | Tragic 2.4% |
| Immigrants | Indonesia | 1.5 /100 | #242 | Tragic 2.4% |
| South Americans | 1.5 /100 | #243 | Tragic 2.4% |
| Peruvians | 1.4 /100 | #244 | Tragic 2.4% |