Samoan vs Basque No Schooling Completed
COMPARE
Samoan
Basque
No Schooling Completed
No Schooling Completed Comparison
Samoans
Basques
2.3%
NO SCHOOLING COMPLETED
8.2/ 100
METRIC RATING
214th/ 347
METRIC RANK
1.8%
NO SCHOOLING COMPLETED
97.9/ 100
METRIC RATING
103rd/ 347
METRIC RANK
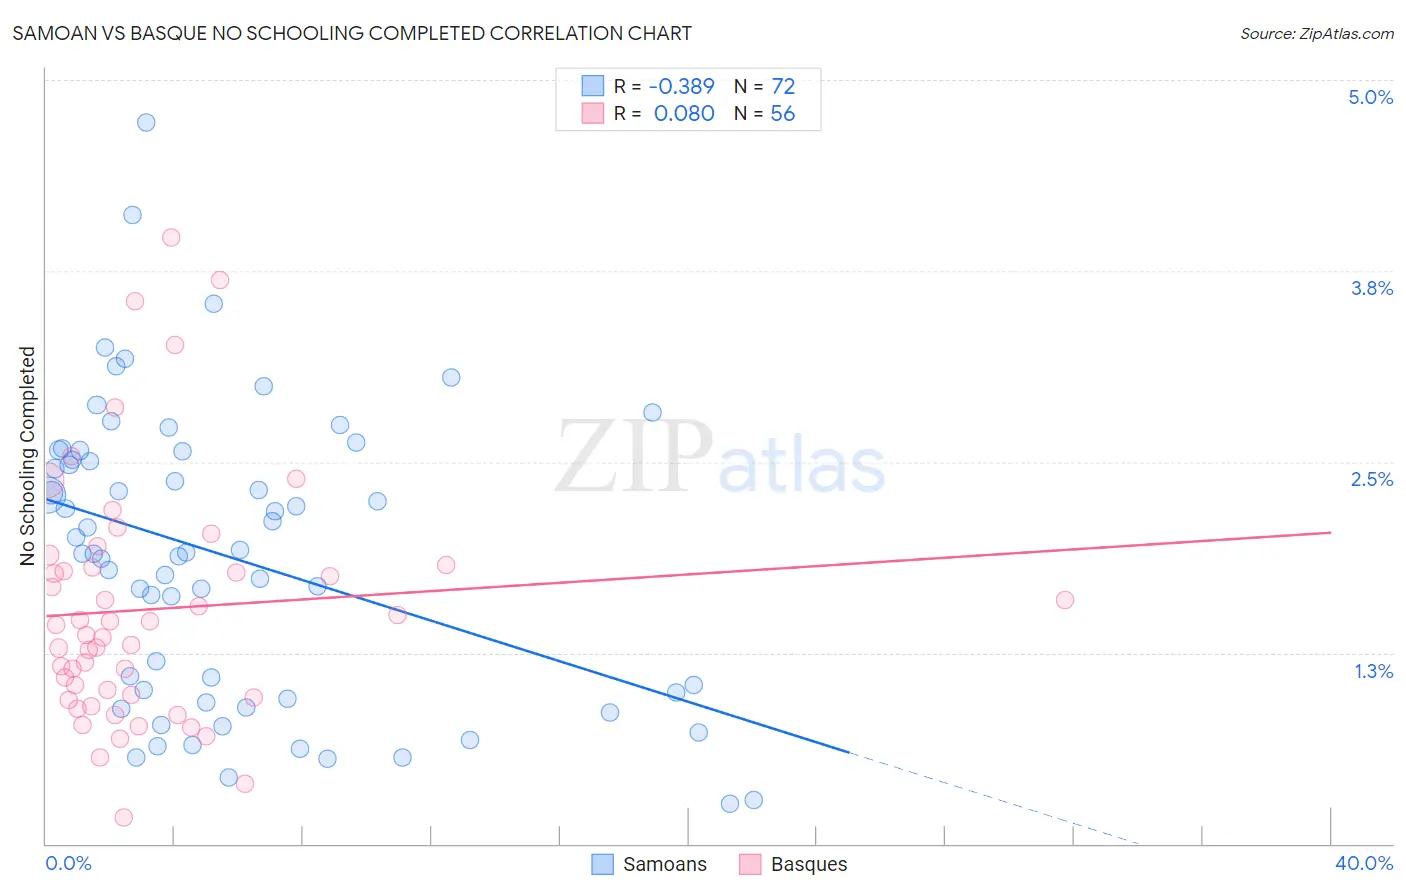
Samoan vs Basque No Schooling Completed Correlation Chart
The statistical analysis conducted on geographies consisting of 223,861,902 people shows a mild negative correlation between the proportion of Samoans and percentage of population with no schooling in the United States with a correlation coefficient (R) of -0.389 and weighted average of 2.3%. Similarly, the statistical analysis conducted on geographies consisting of 164,919,642 people shows a slight positive correlation between the proportion of Basques and percentage of population with no schooling in the United States with a correlation coefficient (R) of 0.080 and weighted average of 1.8%, a difference of 24.1%.
No Schooling Completed Correlation Summary
| Measurement | Samoan | Basque |
| Minimum | 0.26% | 0.17% |
| Maximum | 4.7% | 4.0% |
| Range | 4.5% | 3.8% |
| Mean | 1.9% | 1.5% |
| Median | 1.9% | 1.4% |
| Interquartile 25% (IQ1) | 0.97% | 0.96% |
| Interquartile 75% (IQ3) | 2.5% | 1.8% |
| Interquartile Range (IQR) | 1.6% | 0.85% |
| Standard Deviation (Sample) | 0.95% | 0.80% |
| Standard Deviation (Population) | 0.95% | 0.79% |
Similar Demographics by No Schooling Completed
Demographics Similar to Samoans by No Schooling Completed
In terms of no schooling completed, the demographic groups most similar to Samoans are Ute (2.3%, a difference of 0.040%), Immigrants from Morocco (2.3%, a difference of 0.23%), Immigrants from Panama (2.3%, a difference of 0.24%), Immigrants from Zaire (2.3%, a difference of 0.43%), and Tongan (2.3%, a difference of 0.63%).
| Demographics | Rating | Rank | No Schooling Completed |
| South American Indians | 11.0 /100 | #207 | Poor 2.2% |
| Uruguayans | 11.0 /100 | #208 | Poor 2.2% |
| Immigrants | Oceania | 10.2 /100 | #209 | Poor 2.2% |
| Natives/Alaskans | 10.0 /100 | #210 | Tragic 2.2% |
| Immigrants | Panama | 8.8 /100 | #211 | Tragic 2.3% |
| Immigrants | Morocco | 8.7 /100 | #212 | Tragic 2.3% |
| Ute | 8.2 /100 | #213 | Tragic 2.3% |
| Samoans | 8.2 /100 | #214 | Tragic 2.3% |
| Immigrants | Zaire | 7.2 /100 | #215 | Tragic 2.3% |
| Tongans | 6.8 /100 | #216 | Tragic 2.3% |
| Immigrants | Syria | 6.6 /100 | #217 | Tragic 2.3% |
| Immigrants | Nepal | 6.4 /100 | #218 | Tragic 2.3% |
| Senegalese | 5.6 /100 | #219 | Tragic 2.3% |
| Immigrants | Costa Rica | 5.1 /100 | #220 | Tragic 2.3% |
| Immigrants | Sudan | 5.0 /100 | #221 | Tragic 2.3% |
Demographics Similar to Basques by No Schooling Completed
In terms of no schooling completed, the demographic groups most similar to Basques are Immigrants from Switzerland (1.8%, a difference of 0.050%), Immigrants from Czechoslovakia (1.8%, a difference of 0.060%), Immigrants from Singapore (1.8%, a difference of 0.35%), Choctaw (1.8%, a difference of 0.55%), and Thai (1.8%, a difference of 0.57%).
| Demographics | Rating | Rank | No Schooling Completed |
| Bhutanese | 98.4 /100 | #96 | Exceptional 1.8% |
| Immigrants | Ireland | 98.4 /100 | #97 | Exceptional 1.8% |
| Iranians | 98.2 /100 | #98 | Exceptional 1.8% |
| Choctaw | 98.1 /100 | #99 | Exceptional 1.8% |
| Immigrants | Singapore | 98.0 /100 | #100 | Exceptional 1.8% |
| Immigrants | Czechoslovakia | 97.9 /100 | #101 | Exceptional 1.8% |
| Immigrants | Switzerland | 97.9 /100 | #102 | Exceptional 1.8% |
| Basques | 97.9 /100 | #103 | Exceptional 1.8% |
| Thais | 97.5 /100 | #104 | Exceptional 1.8% |
| German Russians | 97.5 /100 | #105 | Exceptional 1.8% |
| Immigrants | France | 97.3 /100 | #106 | Exceptional 1.8% |
| Yugoslavians | 97.2 /100 | #107 | Exceptional 1.8% |
| Okinawans | 97.1 /100 | #108 | Exceptional 1.8% |
| Immigrants | Saudi Arabia | 96.8 /100 | #109 | Exceptional 1.9% |
| Immigrants | Latvia | 96.7 /100 | #110 | Exceptional 1.9% |