Russian vs Immigrants from Iraq Associate's Degree
COMPARE
Russian
Immigrants from Iraq
Associate's Degree
Associate's Degree Comparison
Russians
Immigrants from Iraq
53.2%
ASSOCIATE'S DEGREE
100.0/ 100
METRIC RATING
35th/ 347
METRIC RANK
46.4%
ASSOCIATE'S DEGREE
50.3/ 100
METRIC RATING
173rd/ 347
METRIC RANK
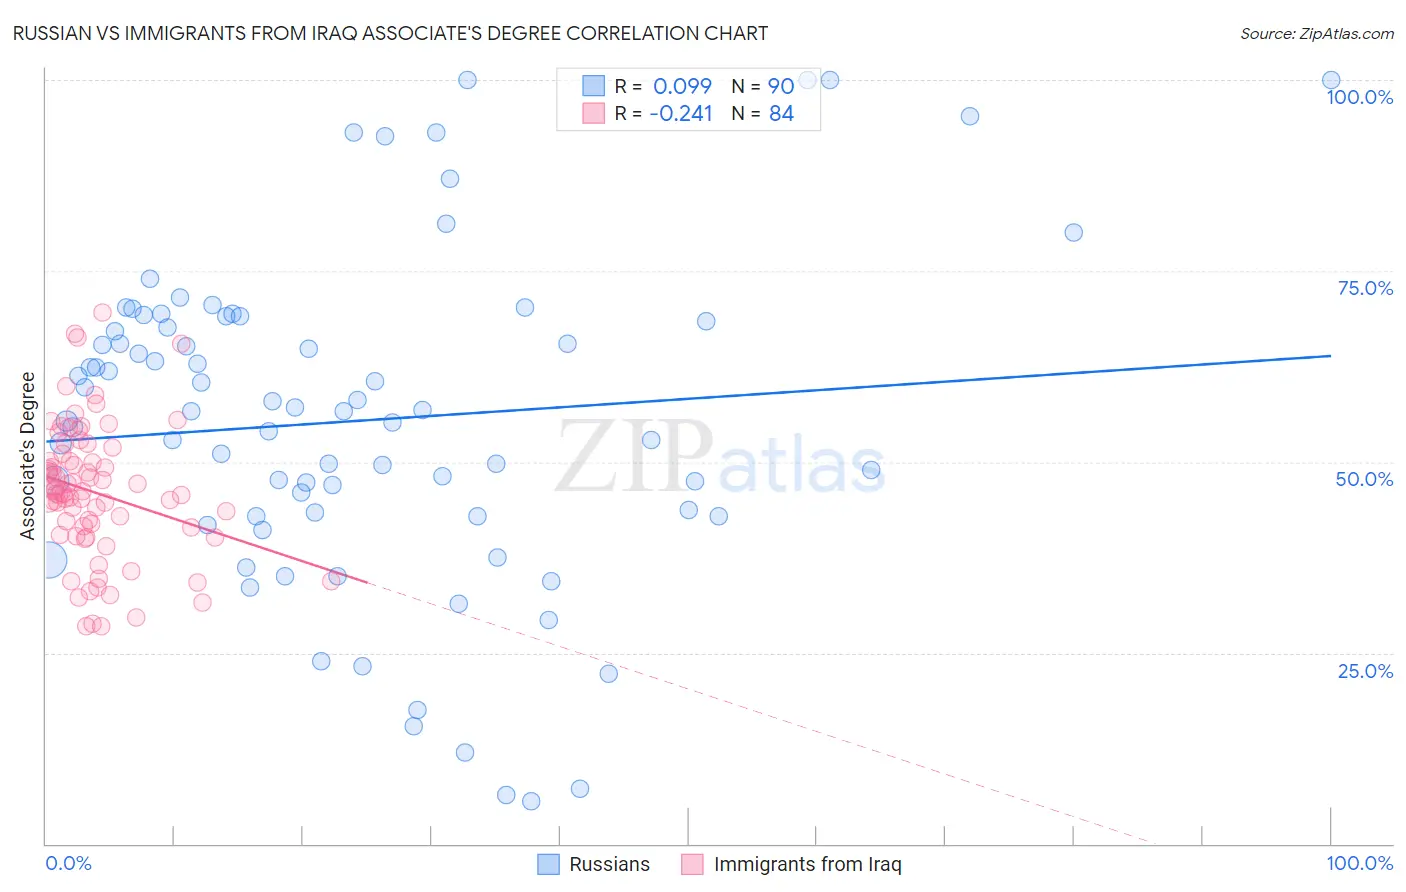
Russian vs Immigrants from Iraq Associate's Degree Correlation Chart
The statistical analysis conducted on geographies consisting of 512,209,602 people shows a slight positive correlation between the proportion of Russians and percentage of population with at least associate's degree education in the United States with a correlation coefficient (R) of 0.099 and weighted average of 53.2%. Similarly, the statistical analysis conducted on geographies consisting of 194,756,177 people shows a weak negative correlation between the proportion of Immigrants from Iraq and percentage of population with at least associate's degree education in the United States with a correlation coefficient (R) of -0.241 and weighted average of 46.4%, a difference of 14.8%.
Associate's Degree Correlation Summary
| Measurement | Russian | Immigrants from Iraq |
| Minimum | 5.6% | 28.4% |
| Maximum | 100.0% | 69.6% |
| Range | 94.4% | 41.2% |
| Mean | 55.4% | 46.0% |
| Median | 56.6% | 46.0% |
| Interquartile 25% (IQ1) | 42.9% | 40.9% |
| Interquartile 75% (IQ3) | 68.4% | 50.6% |
| Interquartile Range (IQR) | 25.5% | 9.7% |
| Standard Deviation (Sample) | 21.5% | 8.8% |
| Standard Deviation (Population) | 21.3% | 8.8% |
Similar Demographics by Associate's Degree
Demographics Similar to Russians by Associate's Degree
In terms of associate's degree, the demographic groups most similar to Russians are Bulgarian (53.3%, a difference of 0.060%), Israeli (53.4%, a difference of 0.26%), Immigrants from Russia (53.1%, a difference of 0.28%), Immigrants from Denmark (53.1%, a difference of 0.36%), and Immigrants from Turkey (53.4%, a difference of 0.38%).
| Demographics | Rating | Rank | Associate's Degree |
| Turks | 100.0 /100 | #28 | Exceptional 53.9% |
| Immigrants | France | 100.0 /100 | #29 | Exceptional 53.9% |
| Immigrants | Sri Lanka | 100.0 /100 | #30 | Exceptional 53.7% |
| Immigrants | Northern Europe | 100.0 /100 | #31 | Exceptional 53.5% |
| Immigrants | Turkey | 100.0 /100 | #32 | Exceptional 53.4% |
| Israelis | 100.0 /100 | #33 | Exceptional 53.4% |
| Bulgarians | 100.0 /100 | #34 | Exceptional 53.3% |
| Russians | 100.0 /100 | #35 | Exceptional 53.2% |
| Immigrants | Russia | 100.0 /100 | #36 | Exceptional 53.1% |
| Immigrants | Denmark | 100.0 /100 | #37 | Exceptional 53.1% |
| Mongolians | 100.0 /100 | #38 | Exceptional 53.0% |
| Immigrants | Belarus | 99.9 /100 | #39 | Exceptional 52.8% |
| Immigrants | Latvia | 99.9 /100 | #40 | Exceptional 52.8% |
| Immigrants | Saudi Arabia | 99.9 /100 | #41 | Exceptional 52.6% |
| Immigrants | Malaysia | 99.9 /100 | #42 | Exceptional 52.5% |
Demographics Similar to Immigrants from Iraq by Associate's Degree
In terms of associate's degree, the demographic groups most similar to Immigrants from Iraq are Peruvian (46.4%, a difference of 0.020%), English (46.4%, a difference of 0.020%), Belgian (46.3%, a difference of 0.10%), Finnish (46.3%, a difference of 0.13%), and Slovak (46.3%, a difference of 0.14%).
| Demographics | Rating | Rank | Associate's Degree |
| Hungarians | 59.3 /100 | #166 | Average 46.7% |
| Immigrants | Sierra Leone | 59.2 /100 | #167 | Average 46.7% |
| Immigrants | Somalia | 55.5 /100 | #168 | Average 46.5% |
| Uruguayans | 55.4 /100 | #169 | Average 46.5% |
| Irish | 53.6 /100 | #170 | Average 46.5% |
| Basques | 52.8 /100 | #171 | Average 46.5% |
| Peruvians | 50.5 /100 | #172 | Average 46.4% |
| Immigrants | Iraq | 50.3 /100 | #173 | Average 46.4% |
| English | 50.0 /100 | #174 | Average 46.4% |
| Belgians | 48.9 /100 | #175 | Average 46.3% |
| Finns | 48.5 /100 | #176 | Average 46.3% |
| Slovaks | 48.4 /100 | #177 | Average 46.3% |
| Immigrants | Bosnia and Herzegovina | 48.3 /100 | #178 | Average 46.3% |
| Sri Lankans | 47.6 /100 | #179 | Average 46.3% |
| Bermudans | 46.4 /100 | #180 | Average 46.2% |