Russian vs Immigrants from Spain Associate's Degree
COMPARE
Russian
Immigrants from Spain
Associate's Degree
Associate's Degree Comparison
Russians
Immigrants from Spain
53.2%
ASSOCIATE'S DEGREE
100.0/ 100
METRIC RATING
35th/ 347
METRIC RANK
51.9%
ASSOCIATE'S DEGREE
99.8/ 100
METRIC RATING
54th/ 347
METRIC RANK
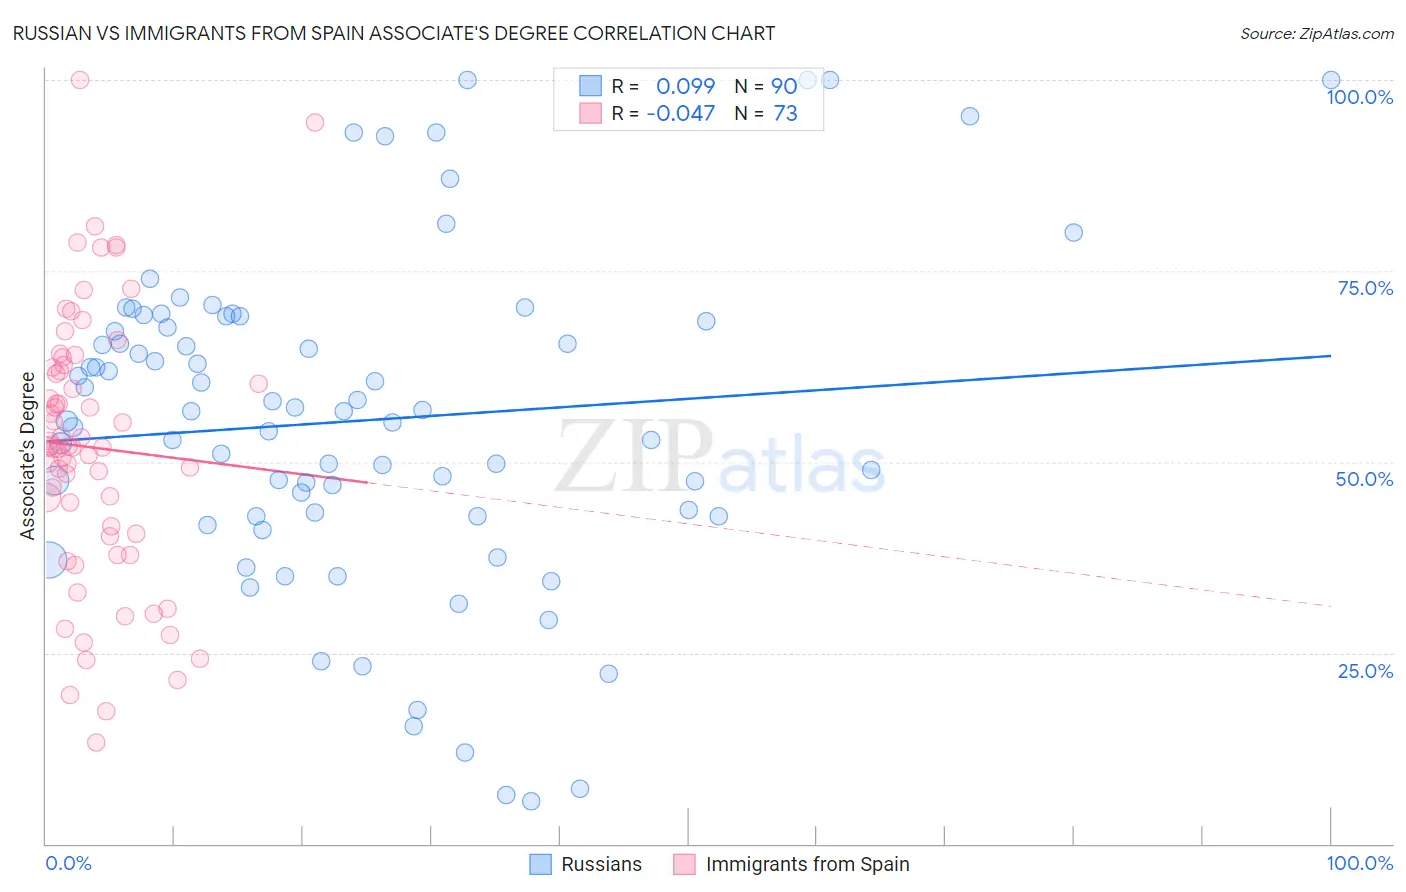
Russian vs Immigrants from Spain Associate's Degree Correlation Chart
The statistical analysis conducted on geographies consisting of 512,209,602 people shows a slight positive correlation between the proportion of Russians and percentage of population with at least associate's degree education in the United States with a correlation coefficient (R) of 0.099 and weighted average of 53.2%. Similarly, the statistical analysis conducted on geographies consisting of 239,681,023 people shows no correlation between the proportion of Immigrants from Spain and percentage of population with at least associate's degree education in the United States with a correlation coefficient (R) of -0.047 and weighted average of 51.9%, a difference of 2.6%.
Associate's Degree Correlation Summary
| Measurement | Russian | Immigrants from Spain |
| Minimum | 5.6% | 13.3% |
| Maximum | 100.0% | 100.0% |
| Range | 94.4% | 86.7% |
| Mean | 55.4% | 51.9% |
| Median | 56.6% | 52.0% |
| Interquartile 25% (IQ1) | 42.9% | 40.4% |
| Interquartile 75% (IQ3) | 68.4% | 62.6% |
| Interquartile Range (IQR) | 25.5% | 22.2% |
| Standard Deviation (Sample) | 21.5% | 17.6% |
| Standard Deviation (Population) | 21.3% | 17.5% |
Demographics Similar to Russians and Immigrants from Spain by Associate's Degree
In terms of associate's degree, the demographic groups most similar to Russians are Bulgarian (53.3%, a difference of 0.060%), Immigrants from Russia (53.1%, a difference of 0.28%), Immigrants from Denmark (53.1%, a difference of 0.36%), Mongolian (53.0%, a difference of 0.53%), and Immigrants from Belarus (52.8%, a difference of 0.82%). Similarly, the demographic groups most similar to Immigrants from Spain are Immigrants from Asia (52.0%, a difference of 0.10%), Bolivian (52.0%, a difference of 0.13%), Immigrants from Greece (52.1%, a difference of 0.34%), Asian (52.1%, a difference of 0.42%), and Immigrants from Austria (52.1%, a difference of 0.43%).
| Demographics | Rating | Rank | Associate's Degree |
| Bulgarians | 100.0 /100 | #34 | Exceptional 53.3% |
| Russians | 100.0 /100 | #35 | Exceptional 53.2% |
| Immigrants | Russia | 100.0 /100 | #36 | Exceptional 53.1% |
| Immigrants | Denmark | 100.0 /100 | #37 | Exceptional 53.1% |
| Mongolians | 100.0 /100 | #38 | Exceptional 53.0% |
| Immigrants | Belarus | 99.9 /100 | #39 | Exceptional 52.8% |
| Immigrants | Latvia | 99.9 /100 | #40 | Exceptional 52.8% |
| Immigrants | Saudi Arabia | 99.9 /100 | #41 | Exceptional 52.6% |
| Immigrants | Malaysia | 99.9 /100 | #42 | Exceptional 52.5% |
| Immigrants | South Africa | 99.9 /100 | #43 | Exceptional 52.5% |
| Estonians | 99.9 /100 | #44 | Exceptional 52.5% |
| Immigrants | Lithuania | 99.9 /100 | #45 | Exceptional 52.4% |
| Immigrants | Bulgaria | 99.9 /100 | #46 | Exceptional 52.4% |
| Immigrants | Kuwait | 99.9 /100 | #47 | Exceptional 52.4% |
| Immigrants | Norway | 99.9 /100 | #48 | Exceptional 52.2% |
| Immigrants | Austria | 99.9 /100 | #49 | Exceptional 52.1% |
| Asians | 99.9 /100 | #50 | Exceptional 52.1% |
| Immigrants | Greece | 99.9 /100 | #51 | Exceptional 52.1% |
| Bolivians | 99.8 /100 | #52 | Exceptional 52.0% |
| Immigrants | Asia | 99.8 /100 | #53 | Exceptional 52.0% |
| Immigrants | Spain | 99.8 /100 | #54 | Exceptional 51.9% |