Romanian vs Colombian 7th Grade
COMPARE
Romanian
Colombian
7th Grade
7th Grade Comparison
Romanians
Colombians
96.7%
7TH GRADE
99.1/ 100
METRIC RATING
84th/ 347
METRIC RANK
95.3%
7TH GRADE
0.8/ 100
METRIC RATING
254th/ 347
METRIC RANK
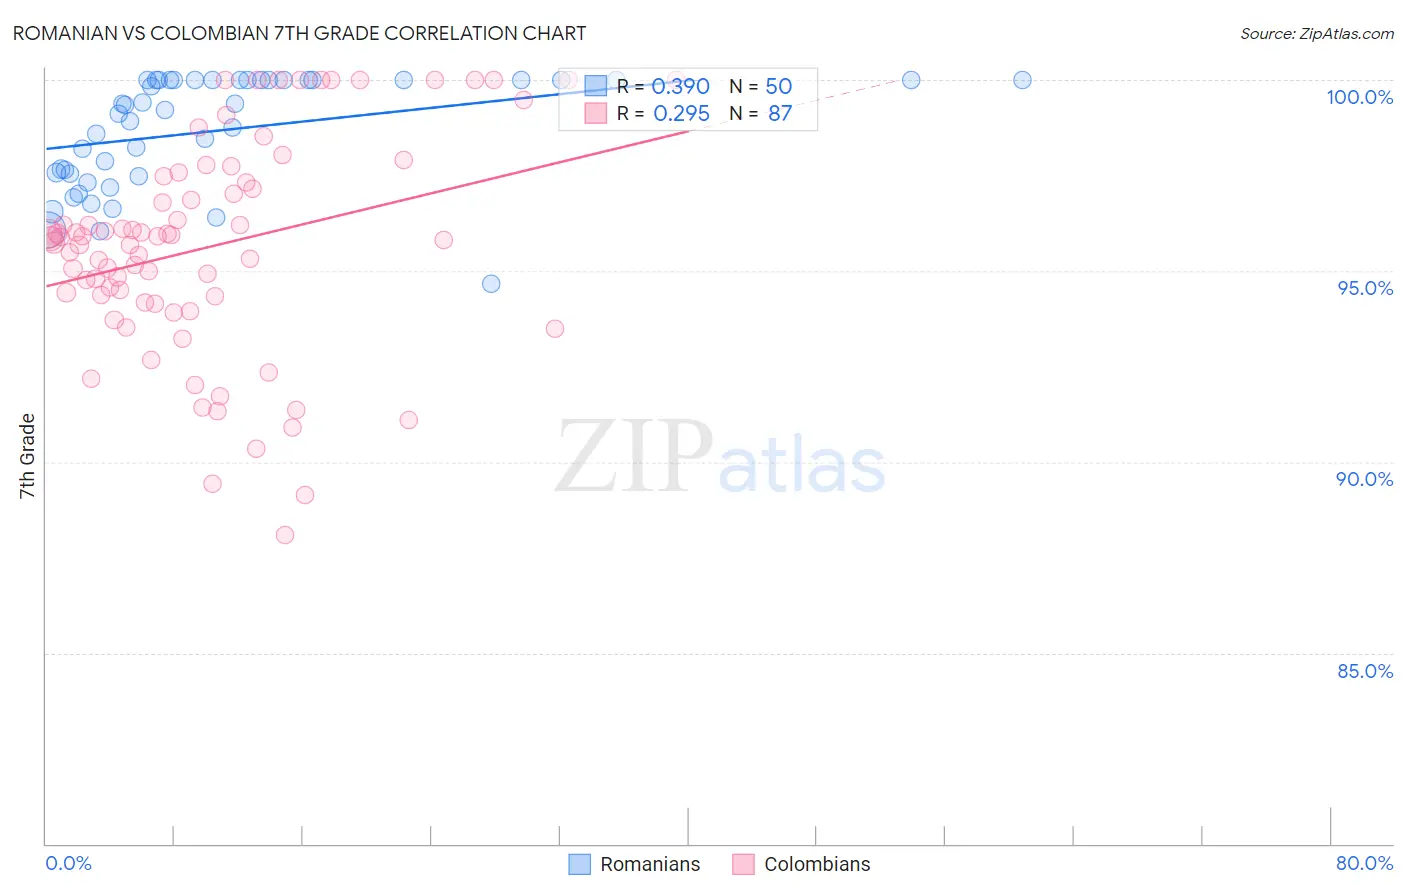
Romanian vs Colombian 7th Grade Correlation Chart
The statistical analysis conducted on geographies consisting of 377,904,438 people shows a mild positive correlation between the proportion of Romanians and percentage of population with at least 7th grade education in the United States with a correlation coefficient (R) of 0.390 and weighted average of 96.7%. Similarly, the statistical analysis conducted on geographies consisting of 419,655,116 people shows a weak positive correlation between the proportion of Colombians and percentage of population with at least 7th grade education in the United States with a correlation coefficient (R) of 0.295 and weighted average of 95.3%, a difference of 1.5%.
7th Grade Correlation Summary
| Measurement | Romanian | Colombian |
| Minimum | 94.7% | 88.1% |
| Maximum | 100.0% | 100.0% |
| Range | 5.3% | 11.9% |
| Mean | 98.7% | 95.6% |
| Median | 99.3% | 95.8% |
| Interquartile 25% (IQ1) | 97.5% | 94.2% |
| Interquartile 75% (IQ3) | 100.0% | 97.5% |
| Interquartile Range (IQR) | 2.5% | 3.3% |
| Standard Deviation (Sample) | 1.5% | 2.8% |
| Standard Deviation (Population) | 1.4% | 2.8% |
Similar Demographics by 7th Grade
Demographics Similar to Romanians by 7th Grade
In terms of 7th grade, the demographic groups most similar to Romanians are Icelander (96.7%, a difference of 0.0%), Kiowa (96.7%, a difference of 0.0%), Chickasaw (96.7%, a difference of 0.010%), Turkish (96.7%, a difference of 0.010%), and Delaware (96.8%, a difference of 0.020%).
| Demographics | Rating | Rank | 7th Grade |
| Cherokee | 99.4 /100 | #77 | Exceptional 96.8% |
| Immigrants | Netherlands | 99.3 /100 | #78 | Exceptional 96.8% |
| Cypriots | 99.3 /100 | #79 | Exceptional 96.8% |
| Yugoslavians | 99.3 /100 | #80 | Exceptional 96.8% |
| Delaware | 99.2 /100 | #81 | Exceptional 96.8% |
| Chickasaw | 99.2 /100 | #82 | Exceptional 96.7% |
| Icelanders | 99.1 /100 | #83 | Exceptional 96.7% |
| Romanians | 99.1 /100 | #84 | Exceptional 96.7% |
| Kiowa | 99.1 /100 | #85 | Exceptional 96.7% |
| Turks | 99.1 /100 | #86 | Exceptional 96.7% |
| Immigrants | Belgium | 99.0 /100 | #87 | Exceptional 96.7% |
| Puget Sound Salish | 99.0 /100 | #88 | Exceptional 96.7% |
| Cree | 99.0 /100 | #89 | Exceptional 96.7% |
| Immigrants | South Africa | 98.9 /100 | #90 | Exceptional 96.7% |
| Osage | 98.9 /100 | #91 | Exceptional 96.7% |
Demographics Similar to Colombians by 7th Grade
In terms of 7th grade, the demographic groups most similar to Colombians are Somali (95.3%, a difference of 0.010%), Korean (95.3%, a difference of 0.010%), Immigrants from Cameroon (95.4%, a difference of 0.020%), Immigrants from Jamaica (95.4%, a difference of 0.020%), and Immigrants from Ethiopia (95.3%, a difference of 0.020%).
| Demographics | Rating | Rank | 7th Grade |
| Tongans | 1.3 /100 | #247 | Tragic 95.4% |
| Paiute | 1.2 /100 | #248 | Tragic 95.4% |
| Bolivians | 1.1 /100 | #249 | Tragic 95.4% |
| Immigrants | Cameroon | 0.9 /100 | #250 | Tragic 95.4% |
| Immigrants | Jamaica | 0.9 /100 | #251 | Tragic 95.4% |
| Immigrants | Ethiopia | 0.9 /100 | #252 | Tragic 95.3% |
| Somalis | 0.9 /100 | #253 | Tragic 95.3% |
| Colombians | 0.8 /100 | #254 | Tragic 95.3% |
| Koreans | 0.8 /100 | #255 | Tragic 95.3% |
| Immigrants | China | 0.7 /100 | #256 | Tragic 95.3% |
| Immigrants | Congo | 0.7 /100 | #257 | Tragic 95.3% |
| Ghanaians | 0.7 /100 | #258 | Tragic 95.3% |
| Immigrants | Costa Rica | 0.6 /100 | #259 | Tragic 95.3% |
| Afghans | 0.5 /100 | #260 | Tragic 95.3% |
| South Americans | 0.5 /100 | #261 | Tragic 95.2% |