Bhutanese vs Immigrants from Laos 7th Grade
COMPARE
Bhutanese
Immigrants from Laos
7th Grade
7th Grade Comparison
Bhutanese
Immigrants from Laos
96.6%
7TH GRADE
97.7/ 100
METRIC RATING
109th/ 347
METRIC RANK
94.5%
7TH GRADE
0.0/ 100
METRIC RATING
302nd/ 347
METRIC RANK
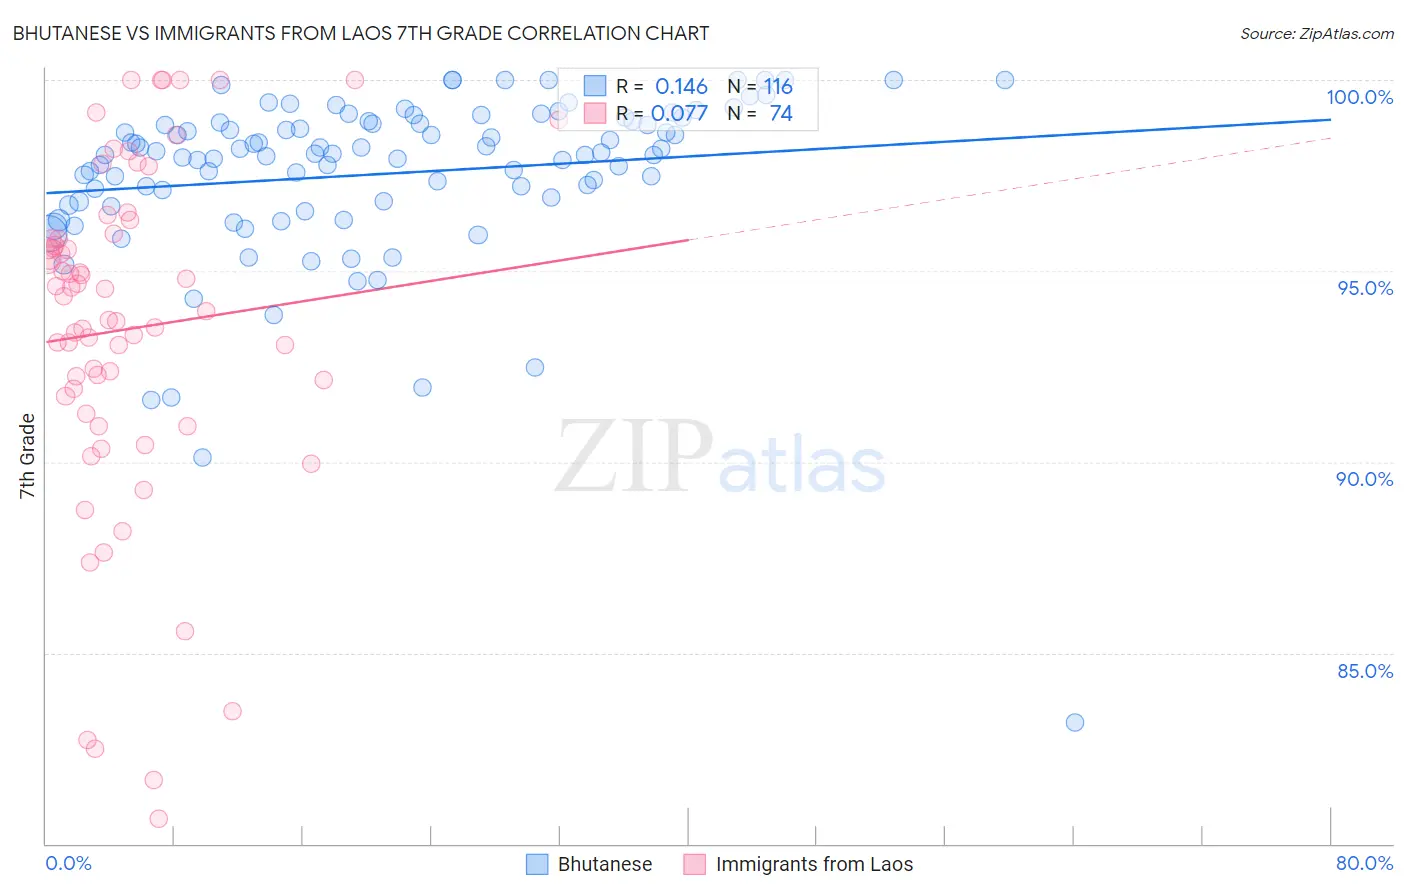
Bhutanese vs Immigrants from Laos 7th Grade Correlation Chart
The statistical analysis conducted on geographies consisting of 455,591,134 people shows a poor positive correlation between the proportion of Bhutanese and percentage of population with at least 7th grade education in the United States with a correlation coefficient (R) of 0.146 and weighted average of 96.6%. Similarly, the statistical analysis conducted on geographies consisting of 201,472,886 people shows a slight positive correlation between the proportion of Immigrants from Laos and percentage of population with at least 7th grade education in the United States with a correlation coefficient (R) of 0.077 and weighted average of 94.5%, a difference of 2.3%.
7th Grade Correlation Summary
| Measurement | Bhutanese | Immigrants from Laos |
| Minimum | 83.2% | 80.6% |
| Maximum | 100.0% | 100.0% |
| Range | 16.8% | 19.4% |
| Mean | 97.5% | 93.5% |
| Median | 98.1% | 94.1% |
| Interquartile 25% (IQ1) | 96.8% | 91.7% |
| Interquartile 75% (IQ3) | 98.9% | 95.8% |
| Interquartile Range (IQR) | 2.1% | 4.1% |
| Standard Deviation (Sample) | 2.3% | 4.5% |
| Standard Deviation (Population) | 2.3% | 4.4% |
Similar Demographics by 7th Grade
Demographics Similar to Bhutanese by 7th Grade
In terms of 7th grade, the demographic groups most similar to Bhutanese are Lumbee (96.6%, a difference of 0.010%), Immigrants from Saudi Arabia (96.6%, a difference of 0.010%), Iroquois (96.6%, a difference of 0.020%), Okinawan (96.6%, a difference of 0.020%), and Immigrants from Latvia (96.6%, a difference of 0.020%).
| Demographics | Rating | Rank | 7th Grade |
| Immigrants | Czechoslovakia | 98.3 /100 | #102 | Exceptional 96.6% |
| Immigrants | Singapore | 98.3 /100 | #103 | Exceptional 96.6% |
| Shoshone | 98.1 /100 | #104 | Exceptional 96.6% |
| South Africans | 98.0 /100 | #105 | Exceptional 96.6% |
| Iroquois | 97.9 /100 | #106 | Exceptional 96.6% |
| Lumbee | 97.8 /100 | #107 | Exceptional 96.6% |
| Immigrants | Saudi Arabia | 97.8 /100 | #108 | Exceptional 96.6% |
| Bhutanese | 97.7 /100 | #109 | Exceptional 96.6% |
| Okinawans | 97.4 /100 | #110 | Exceptional 96.6% |
| Immigrants | Latvia | 97.4 /100 | #111 | Exceptional 96.6% |
| Immigrants | Nonimmigrants | 97.0 /100 | #112 | Exceptional 96.5% |
| Pueblo | 96.8 /100 | #113 | Exceptional 96.5% |
| Immigrants | Zimbabwe | 96.6 /100 | #114 | Exceptional 96.5% |
| Choctaw | 96.6 /100 | #115 | Exceptional 96.5% |
| Syrians | 96.6 /100 | #116 | Exceptional 96.5% |
Demographics Similar to Immigrants from Laos by 7th Grade
In terms of 7th grade, the demographic groups most similar to Immigrants from Laos are Immigrants from Dominica (94.5%, a difference of 0.0%), Immigrants from Burma/Myanmar (94.5%, a difference of 0.030%), Indonesian (94.5%, a difference of 0.070%), Bangladeshi (94.5%, a difference of 0.070%), and Immigrants from South Eastern Asia (94.5%, a difference of 0.080%).
| Demographics | Rating | Rank | 7th Grade |
| Yaqui | 0.0 /100 | #295 | Tragic 94.6% |
| Cubans | 0.0 /100 | #296 | Tragic 94.6% |
| Immigrants | South Eastern Asia | 0.0 /100 | #297 | Tragic 94.5% |
| Indonesians | 0.0 /100 | #298 | Tragic 94.5% |
| Bangladeshis | 0.0 /100 | #299 | Tragic 94.5% |
| Immigrants | Burma/Myanmar | 0.0 /100 | #300 | Tragic 94.5% |
| Immigrants | Dominica | 0.0 /100 | #301 | Tragic 94.5% |
| Immigrants | Laos | 0.0 /100 | #302 | Tragic 94.5% |
| Sri Lankans | 0.0 /100 | #303 | Tragic 94.4% |
| Immigrants | Haiti | 0.0 /100 | #304 | Tragic 94.3% |
| Guyanese | 0.0 /100 | #305 | Tragic 94.3% |
| Immigrants | Guyana | 0.0 /100 | #306 | Tragic 94.2% |
| Immigrants | Portugal | 0.0 /100 | #307 | Tragic 94.2% |
| Cape Verdeans | 0.0 /100 | #308 | Tragic 94.1% |
| Ecuadorians | 0.0 /100 | #309 | Tragic 94.0% |