Romanian vs Immigrants from Peru 7th Grade

COMPARE

Romanian
Race
Ancestry
AfghanAfricanAlaska NativeAlaskan AthabascanAlbanianAleutAlsatianAmericanApacheArabArapahoArgentineanArmenianAssyrian/Chaldean/SyriacAustralianAustrianBahamianBangladeshiBarbadianBasqueBelgianBelizeanBermudanBhutaneseBlackfeetBolivianBrazilianBritishBritish West IndianBulgarianBurmeseCajunCambodianCanadianCape VerdeanCarpatho RusynCelticCentral AmericanCentral American IndianCherokeeCheyenneChickasawChileanChineseChippewaChoctawColombianColvilleComancheCosta RicanCreeCreekCroatianCrowCubanCypriotCzechCzechoslovakianDanishDelawareDominicanDutchDutch West IndianEastern EuropeanEcuadorianEgyptianEnglishEstonianEthiopianEuropeanFijianFilipinoFinnishFrenchFrench American IndianFrench CanadianGermanGerman RussianGhanaianGreekGuamanian/ChamorroGuatemalanGuyaneseHaitianHmongHonduranHopiHoumaHungarianIcelanderIndian (Asian)IndonesianInupiatIranianIraqiIrishIroquoisIsraeliItalianJamaicanJapaneseJordanianKenyanKiowaKoreanLaotianLatvianLebaneseLiberianLithuanianLumbeeLuxembourgerMacedonianMalaysianMalteseMarshalleseMenomineeMexicanMexican American IndianMongolianMoroccanNative HawaiianNavajoNepaleseNew ZealanderNicaraguanNigerianNorthern EuropeanNorwegianOkinawanOsageOttawaPaiutePakistaniPalestinianPanamanianParaguayanPennsylvania GermanPeruvianPimaPolishPortuguesePotawatomiPuebloPuerto RicanPuget Sound SalishRomanianRussianSalvadoranSamoanScandinavianScotch-IrishScottishSeminoleSenegaleseSerbianShoshoneSierra LeoneanSiouxSlavicSlovakSloveneSomaliSouth AfricanSouth AmericanSouth American IndianSoviet UnionSpaniardSpanishSpanish AmericanSpanish American IndianSri LankanSubsaharan AfricanSudaneseSwedishSwissSyrianTaiwaneseThaiTlingit-HaidaTohono O'OdhamTonganTrinidadian and TobagonianTsimshianTurkishU.S. Virgin IslanderUgandanUkrainianUruguayanUteVenezuelanVietnameseWelshWest IndianYakamaYaquiYugoslavianYumanYup'ikZimbabwean
Immigration
NonimmigrantsImmigrantsAfghanistanAfricaAlbaniaArgentinaArmeniaAsiaAustraliaAustriaBahamasBangladeshBarbadosBelarusBelgiumBelizeBoliviaBosnia and HerzegovinaBrazilBulgariaBurma/MyanmarCabo VerdeCambodiaCameroonCanadaCaribbeanCentral AmericaChileChinaColombiaCongoCosta RicaCroatiaCubaCzechoslovakiaDenmarkDominicaDominican RepublicEastern AfricaEastern AsiaEastern EuropeEcuadorEgyptEl SalvadorEnglandEritreaEthiopiaEuropeFijiFranceGermanyGhanaGreeceGrenadaGuatemalaGuyanaHaitiHondurasHong KongHungaryIndiaIndonesiaIranIraqIrelandIsraelItalyJamaicaJapanJordanKazakhstanKenyaKoreaKuwaitLaosLatin AmericaLatviaLebanonLiberiaLithuaniaMalaysiaMexicoMicronesiaMiddle AfricaMoldovaMoroccoNepalNetherlandsNicaraguaNigeriaNorth AmericaNorth MacedoniaNorthern AfricaNorthern EuropeNorwayOceaniaPakistanPanamaPhilippinesPolandPortugalRomaniaRussiaSaudi ArabiaScotlandSenegalSerbiaSierra LeoneSingaporeSomaliaSouth AfricaSouth AmericaSouth Central AsiaSouth Eastern AsiaSouthern EuropeSpainSri LankaSt. Vincent and the GrenadinesSudanSwedenSwitzerlandSyriaTaiwanThailandTrinidad and TobagoTurkeyUgandaUkraineUruguayUzbekistanVenezuelaVietnamWest IndiesWestern AfricaWestern AsiaWestern EuropeYemenZaireZimbabweAzores
Immigrants from Peru
Race
Ancestry
AfghanAfricanAlaska NativeAlaskan AthabascanAlbanianAleutAlsatianAmericanApacheArabArapahoArgentineanArmenianAssyrian/Chaldean/SyriacAustralianAustrianBahamianBangladeshiBarbadianBasqueBelgianBelizeanBermudanBhutaneseBlackfeetBolivianBrazilianBritishBritish West IndianBulgarianBurmeseCajunCambodianCanadianCape VerdeanCarpatho RusynCelticCentral AmericanCentral American IndianCherokeeCheyenneChickasawChileanChineseChippewaChoctawColombianColvilleComancheCosta RicanCreeCreekCroatianCrowCubanCypriotCzechCzechoslovakianDanishDelawareDominicanDutchDutch West IndianEastern EuropeanEcuadorianEgyptianEnglishEstonianEthiopianEuropeanFijianFilipinoFinnishFrenchFrench American IndianFrench CanadianGermanGerman RussianGhanaianGreekGuamanian/ChamorroGuatemalanGuyaneseHaitianHmongHonduranHopiHoumaHungarianIcelanderIndian (Asian)IndonesianInupiatIranianIraqiIrishIroquoisIsraeliItalianJamaicanJapaneseJordanianKenyanKiowaKoreanLaotianLatvianLebaneseLiberianLithuanianLumbeeLuxembourgerMacedonianMalaysianMalteseMarshalleseMenomineeMexicanMexican American IndianMongolianMoroccanNative HawaiianNavajoNepaleseNew ZealanderNicaraguanNigerianNorthern EuropeanNorwegianOkinawanOsageOttawaPaiutePakistaniPalestinianPanamanianParaguayanPennsylvania GermanPeruvianPimaPolishPortuguesePotawatomiPuebloPuerto RicanPuget Sound SalishRussianSalvadoranSamoanScandinavianScotch-IrishScottishSeminoleSenegaleseSerbianShoshoneSierra LeoneanSiouxSlavicSlovakSloveneSomaliSouth AfricanSouth AmericanSouth American IndianSoviet UnionSpaniardSpanishSpanish AmericanSpanish American IndianSri LankanSubsaharan AfricanSudaneseSwedishSwissSyrianTaiwaneseThaiTlingit-HaidaTohono O'OdhamTonganTrinidadian and TobagonianTsimshianTurkishU.S. Virgin IslanderUgandanUkrainianUruguayanUteVenezuelanVietnameseWelshWest IndianYakamaYaquiYugoslavianYumanYup'ikZimbabwean
Immigration
NonimmigrantsImmigrantsAfghanistanAfricaAlbaniaArgentinaArmeniaAsiaAustraliaAustriaBahamasBangladeshBarbadosBelarusBelgiumBelizeBoliviaBosnia and HerzegovinaBrazilBulgariaBurma/MyanmarCabo VerdeCambodiaCameroonCanadaCaribbeanCentral AmericaChileChinaColombiaCongoCosta RicaCroatiaCubaCzechoslovakiaDenmarkDominicaDominican RepublicEastern AfricaEastern AsiaEastern EuropeEcuadorEgyptEl SalvadorEnglandEritreaEthiopiaEuropeFijiFranceGermanyGhanaGreeceGrenadaGuatemalaGuyanaHaitiHondurasHong KongHungaryIndiaIndonesiaIranIraqIrelandIsraelItalyJamaicaJapanJordanKazakhstanKenyaKoreaKuwaitLaosLatin AmericaLatviaLebanonLiberiaLithuaniaMalaysiaMexicoMicronesiaMiddle AfricaMoldovaMoroccoNepalNetherlandsNicaraguaNigeriaNorth AmericaNorth MacedoniaNorthern AfricaNorthern EuropeNorwayOceaniaPakistanPanamaPeruPhilippinesPolandPortugalRomaniaRussiaSaudi ArabiaScotlandSenegalSerbiaSierra LeoneSingaporeSomaliaSouth AfricaSouth AmericaSouth Central AsiaSouth Eastern AsiaSouthern EuropeSpainSri LankaSt. Vincent and the GrenadinesSudanSwedenSwitzerlandSyriaTaiwanThailandTrinidad and TobagoTurkeyUgandaUkraineUruguayUzbekistanVenezuelaVietnamWest IndiesWestern AfricaWestern AsiaWestern EuropeYemenZaireZimbabweAzores
7th Grade
Income
Poverty
Unemployment
Labor Participation
Family Structure
Vehicle Availability
Education Level
Disability

7th Grade Comparison

Romanians

Immigrants from Peru

Exceptional
Tragic
96.7%
7TH GRADE
99.1/ 100
METRIC RATING
84th/ 347
METRIC RANK
94.9%
7TH GRADE
0.0/ 100
METRIC RATING
287th/ 347
METRIC RANK

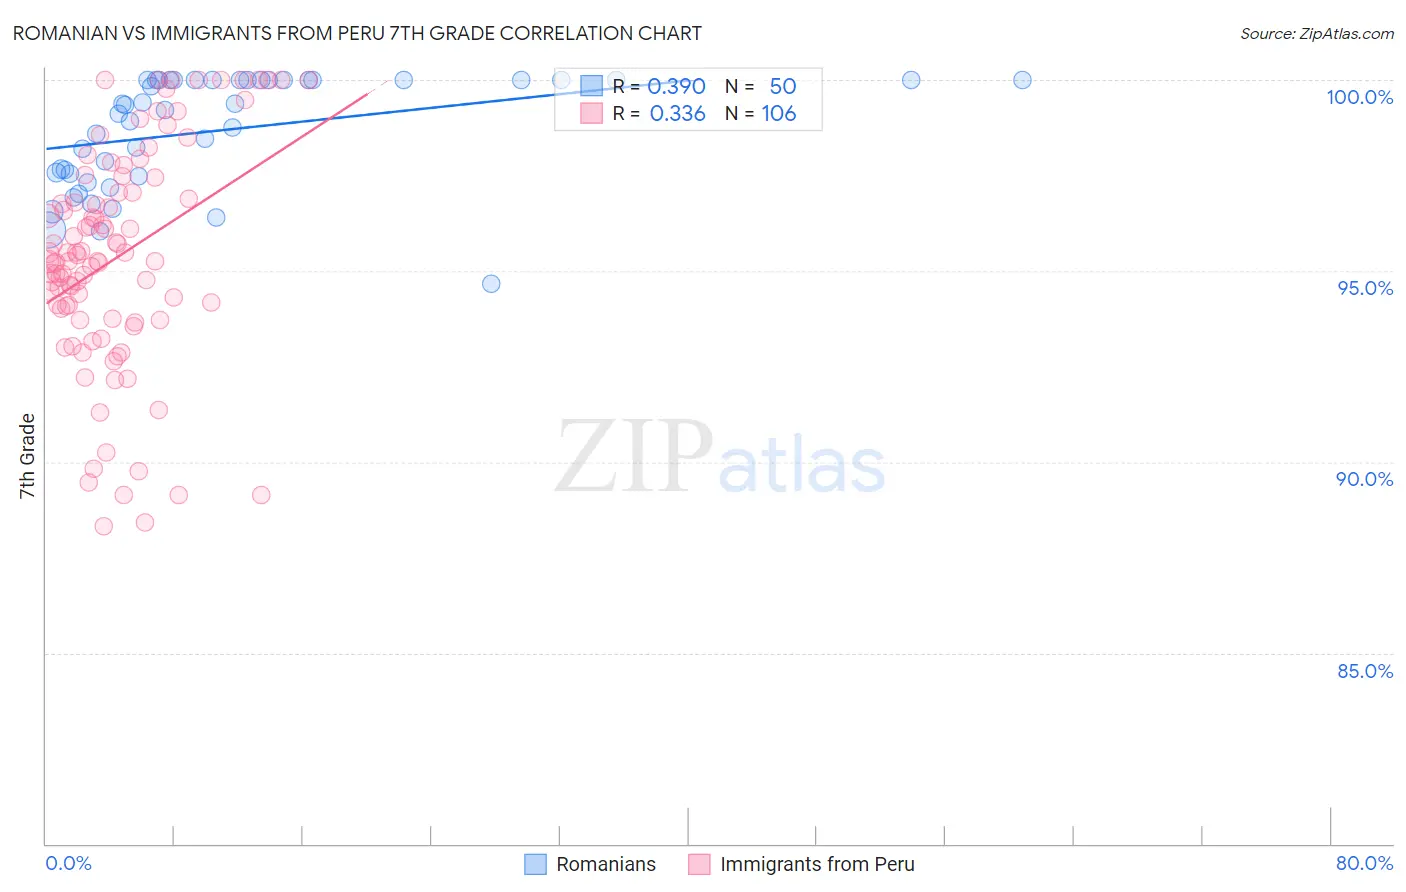
Romanian vs Immigrants from Peru 7th Grade Correlation Chart

The statistical analysis conducted on geographies consisting of 377,904,438 people shows a mild positive correlation between the proportion of Romanians and percentage of population with at least 7th grade education in the United States with a correlation coefficient (R) of 0.390 and weighted average of 96.7%. Similarly, the statistical analysis conducted on geographies consisting of 328,685,851 people shows a mild positive correlation between the proportion of Immigrants from Peru and percentage of population with at least 7th grade education in the United States with a correlation coefficient (R) of 0.336 and weighted average of 94.9%, a difference of 2.0%.
Romanian vs Immigrants from Peru 7th Grade

7th Grade Correlation Summary

MeasurementRomanianImmigrants from Peru
Minimum94.7%88.3%
Maximum100.0%100.0%
Range5.3%11.7%
Mean98.7%95.4%
Median99.3%95.3%
Interquartile 25% (IQ1)97.5%93.7%
Interquartile 75% (IQ3)100.0%97.1%
Interquartile Range (IQR)2.5%3.3%
Standard Deviation (Sample)1.5%2.9%
Standard Deviation (Population)1.4%2.9%

Similar Demographics by 7th Grade

Demographics Similar to Romanians by 7th Grade

In terms of 7th grade, the demographic groups most similar to Romanians are Icelander (96.7%, a difference of 0.0%), Kiowa (96.7%, a difference of 0.0%), Chickasaw (96.7%, a difference of 0.010%), Turkish (96.7%, a difference of 0.010%), and Delaware (96.8%, a difference of 0.020%).
DemographicsRating | Rank7th Grade
Cherokee
99.4
/100
|
#77
Exceptional
96.8%
Immigrants | Netherlands
99.3
/100
|
#78
Exceptional
96.8%
Cypriots
99.3
/100
|
#79
Exceptional
96.8%
Yugoslavians
99.3
/100
|
#80
Exceptional
96.8%
Delaware
99.2
/100
|
#81
Exceptional
96.8%
Chickasaw
99.2
/100
|
#82
Exceptional
96.7%
Icelanders
99.1
/100
|
#83
Exceptional
96.7%
Romanians
99.1
/100
|
#84
Exceptional
96.7%
Kiowa
99.1
/100
|
#85
Exceptional
96.7%
Turks
99.1
/100
|
#86
Exceptional
96.7%
Immigrants | Belgium
99.0
/100
|
#87
Exceptional
96.7%
Puget Sound Salish
99.0
/100
|
#88
Exceptional
96.7%
Cree
99.0
/100
|
#89
Exceptional
96.7%
Immigrants | South Africa
98.9
/100
|
#90
Exceptional
96.7%
Osage
98.9
/100
|
#91
Exceptional
96.7%

Demographics Similar to Immigrants from Peru by 7th Grade

In terms of 7th grade, the demographic groups most similar to Immigrants from Peru are Immigrants from Philippines (94.9%, a difference of 0.010%), British West Indian (94.8%, a difference of 0.020%), Taiwanese (94.8%, a difference of 0.030%), Malaysian (94.8%, a difference of 0.050%), and Armenian (95.0%, a difference of 0.090%).
DemographicsRating | Rank7th Grade
Immigrants | St. Vincent and the Grenadines
0.1
/100
|
#280
Tragic
95.0%
Tohono O'odham
0.1
/100
|
#281
Tragic
95.0%
Immigrants | Bolivia
0.1
/100
|
#282
Tragic
95.0%
Immigrants | Barbados
0.1
/100
|
#283
Tragic
95.0%
Armenians
0.1
/100
|
#284
Tragic
95.0%
Immigrants | Eritrea
0.1
/100
|
#285
Tragic
94.9%
Immigrants | Philippines
0.0
/100
|
#286
Tragic
94.9%
Immigrants | Peru
0.0
/100
|
#287
Tragic
94.9%
British West Indians
0.0
/100
|
#288
Tragic
94.8%
Taiwanese
0.0
/100
|
#289
Tragic
94.8%
Malaysians
0.0
/100
|
#290
Tragic
94.8%
Immigrants | Grenada
0.0
/100
|
#291
Tragic
94.8%
Immigrants | West Indies
0.0
/100
|
#292
Tragic
94.8%
Fijians
0.0
/100
|
#293
Tragic
94.7%
Haitians
0.0
/100
|
#294
Tragic
94.7%