Romanian vs Immigrants from Poland 7th Grade
COMPARE
Romanian
Immigrants from Poland
7th Grade
7th Grade Comparison
Romanians
Immigrants from Poland
96.7%
7TH GRADE
99.1/ 100
METRIC RATING
84th/ 347
METRIC RANK
96.1%
7TH GRADE
59.0/ 100
METRIC RATING
168th/ 347
METRIC RANK
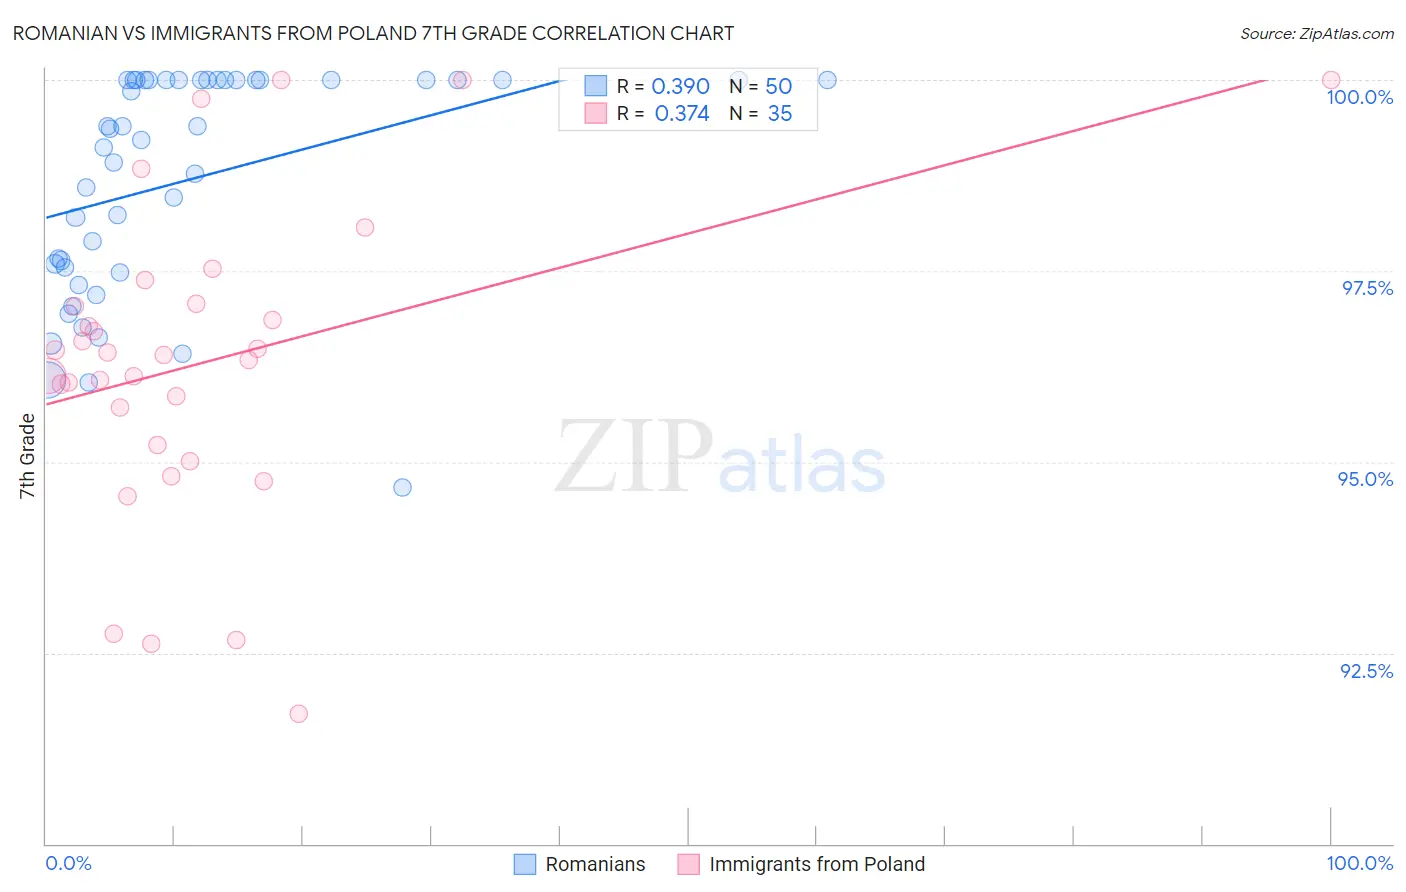
Romanian vs Immigrants from Poland 7th Grade Correlation Chart
The statistical analysis conducted on geographies consisting of 377,904,438 people shows a mild positive correlation between the proportion of Romanians and percentage of population with at least 7th grade education in the United States with a correlation coefficient (R) of 0.390 and weighted average of 96.7%. Similarly, the statistical analysis conducted on geographies consisting of 304,861,877 people shows a mild positive correlation between the proportion of Immigrants from Poland and percentage of population with at least 7th grade education in the United States with a correlation coefficient (R) of 0.374 and weighted average of 96.1%, a difference of 0.67%.
7th Grade Correlation Summary
| Measurement | Romanian | Immigrants from Poland |
| Minimum | 94.7% | 91.7% |
| Maximum | 100.0% | 100.0% |
| Range | 5.3% | 8.3% |
| Mean | 98.7% | 96.3% |
| Median | 99.3% | 96.4% |
| Interquartile 25% (IQ1) | 97.5% | 95.2% |
| Interquartile 75% (IQ3) | 100.0% | 97.1% |
| Interquartile Range (IQR) | 2.5% | 1.8% |
| Standard Deviation (Sample) | 1.5% | 2.0% |
| Standard Deviation (Population) | 1.4% | 2.0% |
Similar Demographics by 7th Grade
Demographics Similar to Romanians by 7th Grade
In terms of 7th grade, the demographic groups most similar to Romanians are Icelander (96.7%, a difference of 0.0%), Kiowa (96.7%, a difference of 0.0%), Chickasaw (96.7%, a difference of 0.010%), Turkish (96.7%, a difference of 0.010%), and Delaware (96.8%, a difference of 0.020%).
| Demographics | Rating | Rank | 7th Grade |
| Cherokee | 99.4 /100 | #77 | Exceptional 96.8% |
| Immigrants | Netherlands | 99.3 /100 | #78 | Exceptional 96.8% |
| Cypriots | 99.3 /100 | #79 | Exceptional 96.8% |
| Yugoslavians | 99.3 /100 | #80 | Exceptional 96.8% |
| Delaware | 99.2 /100 | #81 | Exceptional 96.8% |
| Chickasaw | 99.2 /100 | #82 | Exceptional 96.7% |
| Icelanders | 99.1 /100 | #83 | Exceptional 96.7% |
| Romanians | 99.1 /100 | #84 | Exceptional 96.7% |
| Kiowa | 99.1 /100 | #85 | Exceptional 96.7% |
| Turks | 99.1 /100 | #86 | Exceptional 96.7% |
| Immigrants | Belgium | 99.0 /100 | #87 | Exceptional 96.7% |
| Puget Sound Salish | 99.0 /100 | #88 | Exceptional 96.7% |
| Cree | 99.0 /100 | #89 | Exceptional 96.7% |
| Immigrants | South Africa | 98.9 /100 | #90 | Exceptional 96.7% |
| Osage | 98.9 /100 | #91 | Exceptional 96.7% |
Demographics Similar to Immigrants from Poland by 7th Grade
In terms of 7th grade, the demographic groups most similar to Immigrants from Poland are Immigrants from Kazakhstan (96.1%, a difference of 0.010%), Immigrants from Sri Lanka (96.1%, a difference of 0.010%), Spaniard (96.1%, a difference of 0.020%), Immigrants from Italy (96.1%, a difference of 0.020%), and Immigrants from Taiwan (96.1%, a difference of 0.020%).
| Demographics | Rating | Rank | 7th Grade |
| Bermudans | 66.3 /100 | #161 | Good 96.1% |
| Pima | 64.3 /100 | #162 | Good 96.1% |
| Spaniards | 62.6 /100 | #163 | Good 96.1% |
| Immigrants | Italy | 62.1 /100 | #164 | Good 96.1% |
| Immigrants | Taiwan | 61.5 /100 | #165 | Good 96.1% |
| Immigrants | Kazakhstan | 61.0 /100 | #166 | Good 96.1% |
| Immigrants | Sri Lanka | 59.9 /100 | #167 | Average 96.1% |
| Immigrants | Poland | 59.0 /100 | #168 | Average 96.1% |
| Ute | 55.8 /100 | #169 | Average 96.1% |
| Immigrants | Ukraine | 55.0 /100 | #170 | Average 96.1% |
| Egyptians | 54.2 /100 | #171 | Average 96.1% |
| Venezuelans | 51.4 /100 | #172 | Average 96.0% |
| Immigrants | Albania | 50.4 /100 | #173 | Average 96.0% |
| Mongolians | 50.0 /100 | #174 | Average 96.0% |
| Blacks/African Americans | 49.5 /100 | #175 | Average 96.0% |