Puget Sound Salish vs Armenian 1st Grade
COMPARE
Puget Sound Salish
Armenian
1st Grade
1st Grade Comparison
Puget Sound Salish
Armenians
98.2%
1ST GRADE
98.2/ 100
METRIC RATING
99th/ 347
METRIC RANK
97.5%
1ST GRADE
0.5/ 100
METRIC RATING
260th/ 347
METRIC RANK
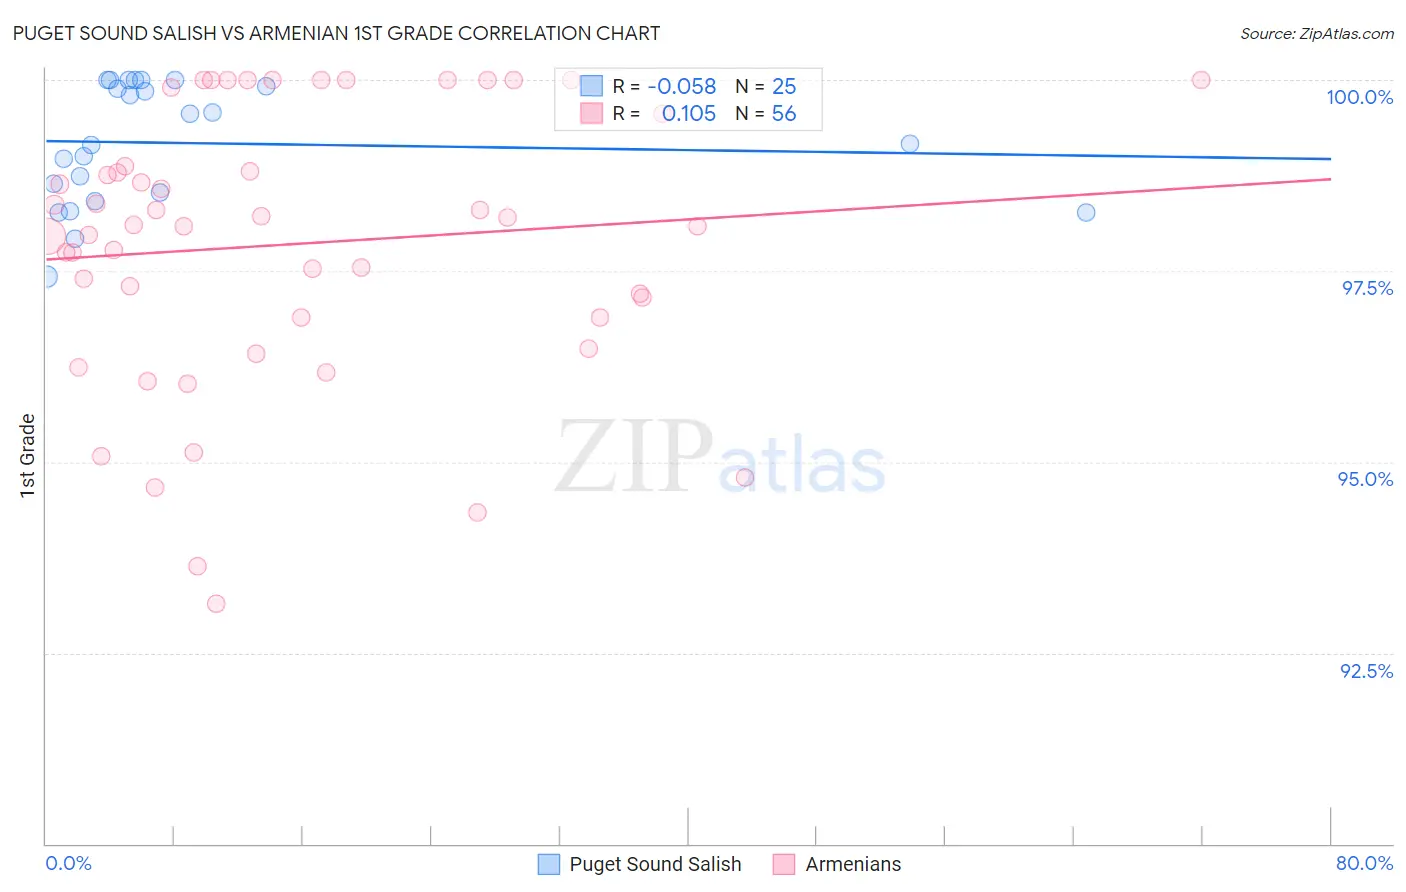
Puget Sound Salish vs Armenian 1st Grade Correlation Chart
The statistical analysis conducted on geographies consisting of 46,155,746 people shows a slight negative correlation between the proportion of Puget Sound Salish and percentage of population with at least 1st grade education in the United States with a correlation coefficient (R) of -0.058 and weighted average of 98.2%. Similarly, the statistical analysis conducted on geographies consisting of 310,954,660 people shows a poor positive correlation between the proportion of Armenians and percentage of population with at least 1st grade education in the United States with a correlation coefficient (R) of 0.105 and weighted average of 97.5%, a difference of 0.73%.
1st Grade Correlation Summary
| Measurement | Puget Sound Salish | Armenian |
| Minimum | 97.4% | 93.1% |
| Maximum | 100.0% | 100.0% |
| Range | 2.6% | 6.9% |
| Mean | 99.2% | 97.9% |
| Median | 99.2% | 98.1% |
| Interquartile 25% (IQ1) | 98.5% | 96.9% |
| Interquartile 75% (IQ3) | 100.0% | 99.2% |
| Interquartile Range (IQR) | 1.5% | 2.3% |
| Standard Deviation (Sample) | 0.79% | 1.8% |
| Standard Deviation (Population) | 0.77% | 1.8% |
Similar Demographics by 1st Grade
Demographics Similar to Puget Sound Salish by 1st Grade
In terms of 1st grade, the demographic groups most similar to Puget Sound Salish are Cypriot (98.2%, a difference of 0.0%), Nonimmigrants (98.2%, a difference of 0.0%), Choctaw (98.2%, a difference of 0.0%), Immigrants from Germany (98.2%, a difference of 0.010%), and Colville (98.2%, a difference of 0.010%).
| Demographics | Rating | Rank | 1st Grade |
| Macedonians | 98.7 /100 | #92 | Exceptional 98.3% |
| Immigrants | India | 98.6 /100 | #93 | Exceptional 98.2% |
| South Africans | 98.6 /100 | #94 | Exceptional 98.2% |
| Immigrants | Germany | 98.5 /100 | #95 | Exceptional 98.2% |
| Cypriots | 98.3 /100 | #96 | Exceptional 98.2% |
| Immigrants | Nonimmigrants | 98.3 /100 | #97 | Exceptional 98.2% |
| Choctaw | 98.3 /100 | #98 | Exceptional 98.2% |
| Puget Sound Salish | 98.2 /100 | #99 | Exceptional 98.2% |
| Colville | 98.0 /100 | #100 | Exceptional 98.2% |
| Romanians | 97.8 /100 | #101 | Exceptional 98.2% |
| Cree | 97.8 /100 | #102 | Exceptional 98.2% |
| Immigrants | Ireland | 97.7 /100 | #103 | Exceptional 98.2% |
| Pima | 97.5 /100 | #104 | Exceptional 98.2% |
| Basques | 97.4 /100 | #105 | Exceptional 98.2% |
| Turks | 97.4 /100 | #106 | Exceptional 98.2% |
Demographics Similar to Armenians by 1st Grade
In terms of 1st grade, the demographic groups most similar to Armenians are Fijian (97.5%, a difference of 0.0%), Yaqui (97.5%, a difference of 0.010%), Indian (Asian) (97.5%, a difference of 0.010%), Immigrants from Ethiopia (97.5%, a difference of 0.010%), and Assyrian/Chaldean/Syriac (97.5%, a difference of 0.010%).
| Demographics | Rating | Rank | 1st Grade |
| Immigrants | Congo | 0.7 /100 | #253 | Tragic 97.5% |
| Immigrants | Asia | 0.7 /100 | #254 | Tragic 97.5% |
| Immigrants | Colombia | 0.6 /100 | #255 | Tragic 97.5% |
| Jamaicans | 0.6 /100 | #256 | Tragic 97.5% |
| Yaqui | 0.6 /100 | #257 | Tragic 97.5% |
| Indians (Asian) | 0.6 /100 | #258 | Tragic 97.5% |
| Fijians | 0.5 /100 | #259 | Tragic 97.5% |
| Armenians | 0.5 /100 | #260 | Tragic 97.5% |
| Immigrants | Ethiopia | 0.4 /100 | #261 | Tragic 97.5% |
| Assyrians/Chaldeans/Syriacs | 0.4 /100 | #262 | Tragic 97.5% |
| Immigrants | South America | 0.4 /100 | #263 | Tragic 97.5% |
| Taiwanese | 0.4 /100 | #264 | Tragic 97.5% |
| Cubans | 0.3 /100 | #265 | Tragic 97.5% |
| Immigrants | Liberia | 0.3 /100 | #266 | Tragic 97.5% |
| Immigrants | Sierra Leone | 0.3 /100 | #267 | Tragic 97.5% |