Ecuadorian vs Thai 1st Grade
COMPARE
Ecuadorian
Thai
1st Grade
1st Grade Comparison
Ecuadorians
Thais
97.0%
1ST GRADE
0.0/ 100
METRIC RATING
305th/ 347
METRIC RANK
98.1%
1ST GRADE
94.7/ 100
METRIC RATING
119th/ 347
METRIC RANK
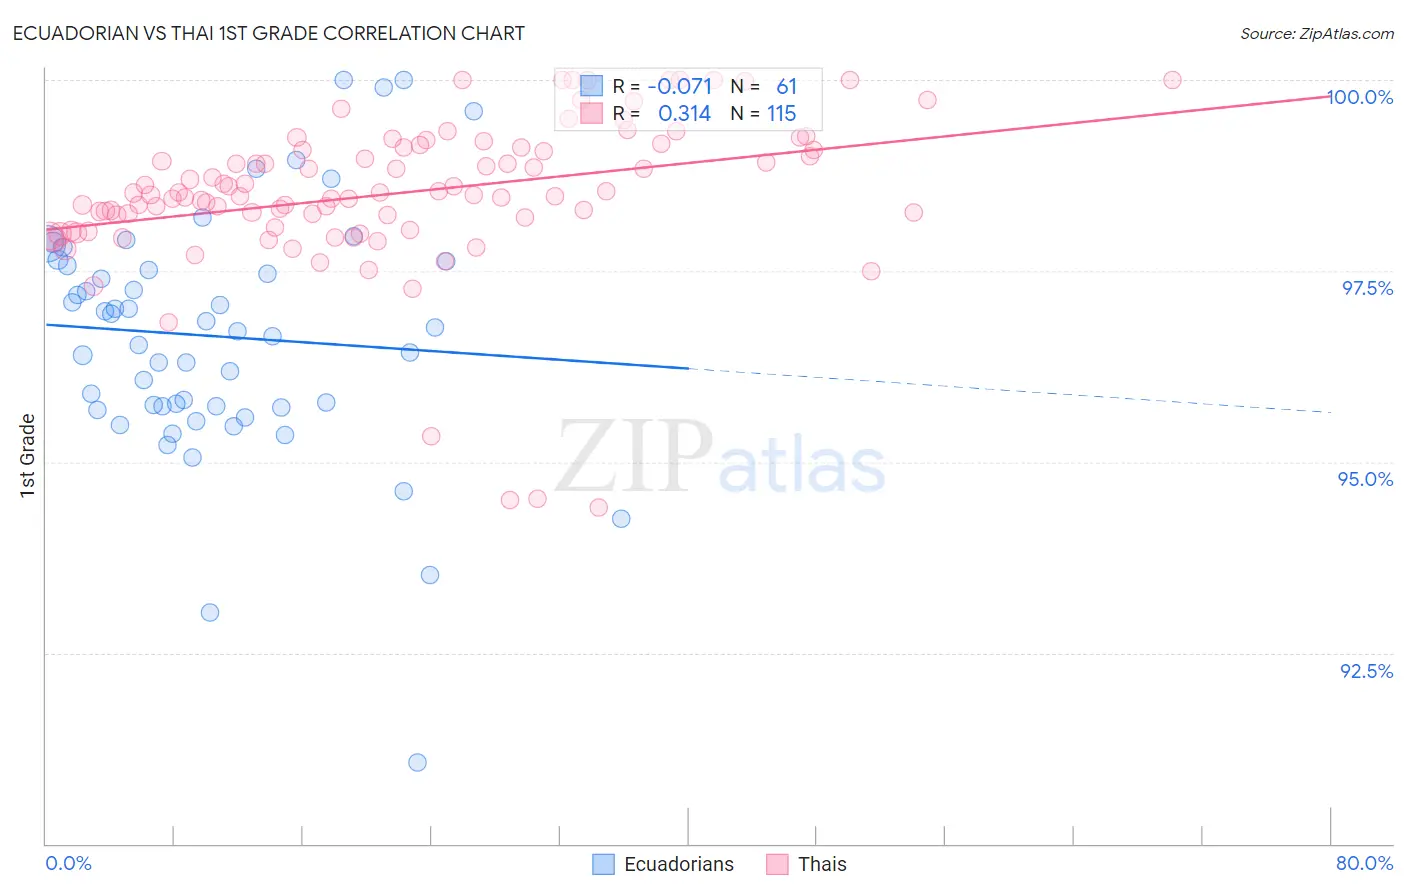
Ecuadorian vs Thai 1st Grade Correlation Chart
The statistical analysis conducted on geographies consisting of 317,865,723 people shows a slight negative correlation between the proportion of Ecuadorians and percentage of population with at least 1st grade education in the United States with a correlation coefficient (R) of -0.071 and weighted average of 97.0%. Similarly, the statistical analysis conducted on geographies consisting of 475,866,115 people shows a mild positive correlation between the proportion of Thais and percentage of population with at least 1st grade education in the United States with a correlation coefficient (R) of 0.314 and weighted average of 98.1%, a difference of 1.2%.
1st Grade Correlation Summary
| Measurement | Ecuadorian | Thai |
| Minimum | 91.1% | 94.4% |
| Maximum | 100.0% | 100.0% |
| Range | 8.9% | 5.6% |
| Mean | 96.6% | 98.5% |
| Median | 96.7% | 98.5% |
| Interquartile 25% (IQ1) | 95.7% | 98.1% |
| Interquartile 75% (IQ3) | 97.6% | 99.1% |
| Interquartile Range (IQR) | 1.9% | 1.0% |
| Standard Deviation (Sample) | 1.6% | 1.0% |
| Standard Deviation (Population) | 1.6% | 1.0% |
Similar Demographics by 1st Grade
Demographics Similar to Ecuadorians by 1st Grade
In terms of 1st grade, the demographic groups most similar to Ecuadorians are Nicaraguan (97.0%, a difference of 0.0%), Somali (97.0%, a difference of 0.020%), Immigrants from Caribbean (97.0%, a difference of 0.050%), Belizean (96.9%, a difference of 0.060%), and Immigrants from Somalia (96.9%, a difference of 0.060%).
| Demographics | Rating | Rank | 1st Grade |
| Immigrants | Dominica | 0.0 /100 | #298 | Tragic 97.1% |
| Immigrants | Cuba | 0.0 /100 | #299 | Tragic 97.1% |
| Haitians | 0.0 /100 | #300 | Tragic 97.1% |
| Immigrants | South Eastern Asia | 0.0 /100 | #301 | Tragic 97.1% |
| Immigrants | Caribbean | 0.0 /100 | #302 | Tragic 97.0% |
| Somalis | 0.0 /100 | #303 | Tragic 97.0% |
| Nicaraguans | 0.0 /100 | #304 | Tragic 97.0% |
| Ecuadorians | 0.0 /100 | #305 | Tragic 97.0% |
| Belizeans | 0.0 /100 | #306 | Tragic 96.9% |
| Immigrants | Somalia | 0.0 /100 | #307 | Tragic 96.9% |
| Hispanics or Latinos | 0.0 /100 | #308 | Tragic 96.9% |
| Immigrants | Haiti | 0.0 /100 | #309 | Tragic 96.9% |
| Immigrants | Azores | 0.0 /100 | #310 | Tragic 96.9% |
| Sri Lankans | 0.0 /100 | #311 | Tragic 96.9% |
| Cape Verdeans | 0.0 /100 | #312 | Tragic 96.9% |
Demographics Similar to Thais by 1st Grade
In terms of 1st grade, the demographic groups most similar to Thais are Okinawan (98.1%, a difference of 0.0%), Yugoslavian (98.2%, a difference of 0.010%), Immigrants from France (98.2%, a difference of 0.010%), Immigrants from Zimbabwe (98.1%, a difference of 0.010%), and Menominee (98.1%, a difference of 0.010%).
| Demographics | Rating | Rank | 1st Grade |
| Immigrants | Norway | 96.6 /100 | #112 | Exceptional 98.2% |
| Immigrants | Latvia | 96.4 /100 | #113 | Exceptional 98.2% |
| Ute | 96.2 /100 | #114 | Exceptional 98.2% |
| Iranians | 96.0 /100 | #115 | Exceptional 98.2% |
| Spanish | 95.9 /100 | #116 | Exceptional 98.2% |
| Yugoslavians | 95.5 /100 | #117 | Exceptional 98.2% |
| Immigrants | France | 95.5 /100 | #118 | Exceptional 98.2% |
| Thais | 94.7 /100 | #119 | Exceptional 98.1% |
| Okinawans | 94.5 /100 | #120 | Exceptional 98.1% |
| Immigrants | Zimbabwe | 94.0 /100 | #121 | Exceptional 98.1% |
| Menominee | 93.9 /100 | #122 | Exceptional 98.1% |
| Iroquois | 93.8 /100 | #123 | Exceptional 98.1% |
| Syrians | 93.7 /100 | #124 | Exceptional 98.1% |
| Immigrants | Japan | 93.7 /100 | #125 | Exceptional 98.1% |
| Lebanese | 93.5 /100 | #126 | Exceptional 98.1% |