Swiss vs Thai 1st Grade
COMPARE
Swiss
Thai
1st Grade
1st Grade Comparison
Swiss
Thais
98.5%
1ST GRADE
100.0/ 100
METRIC RATING
34th/ 347
METRIC RANK
98.1%
1ST GRADE
94.7/ 100
METRIC RATING
119th/ 347
METRIC RANK
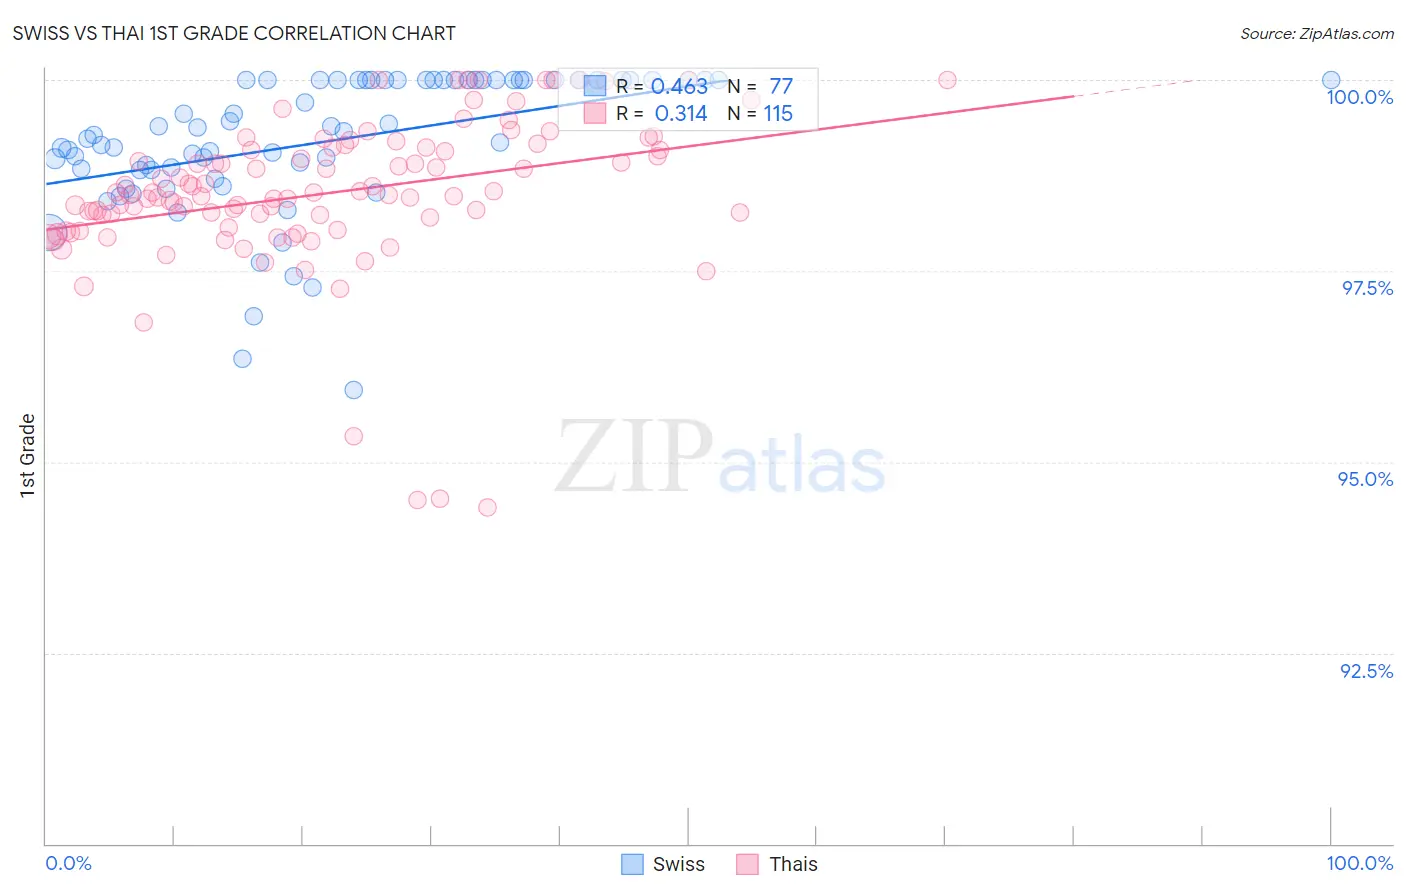
Swiss vs Thai 1st Grade Correlation Chart
The statistical analysis conducted on geographies consisting of 465,023,158 people shows a moderate positive correlation between the proportion of Swiss and percentage of population with at least 1st grade education in the United States with a correlation coefficient (R) of 0.463 and weighted average of 98.5%. Similarly, the statistical analysis conducted on geographies consisting of 475,866,115 people shows a mild positive correlation between the proportion of Thais and percentage of population with at least 1st grade education in the United States with a correlation coefficient (R) of 0.314 and weighted average of 98.1%, a difference of 0.38%.
1st Grade Correlation Summary
| Measurement | Swiss | Thai |
| Minimum | 95.9% | 94.4% |
| Maximum | 100.0% | 100.0% |
| Range | 4.1% | 5.6% |
| Mean | 99.2% | 98.5% |
| Median | 99.3% | 98.5% |
| Interquartile 25% (IQ1) | 98.8% | 98.1% |
| Interquartile 75% (IQ3) | 100.0% | 99.1% |
| Interquartile Range (IQR) | 1.2% | 1.0% |
| Standard Deviation (Sample) | 0.91% | 1.0% |
| Standard Deviation (Population) | 0.90% | 1.0% |
Similar Demographics by 1st Grade
Demographics Similar to Swiss by 1st Grade
In terms of 1st grade, the demographic groups most similar to Swiss are Chinese (98.5%, a difference of 0.0%), Scandinavian (98.5%, a difference of 0.020%), British (98.5%, a difference of 0.020%), European (98.5%, a difference of 0.030%), and Czech (98.5%, a difference of 0.030%).
| Demographics | Rating | Rank | 1st Grade |
| Poles | 100.0 /100 | #27 | Exceptional 98.6% |
| Croatians | 100.0 /100 | #28 | Exceptional 98.6% |
| French | 100.0 /100 | #29 | Exceptional 98.6% |
| Europeans | 100.0 /100 | #30 | Exceptional 98.5% |
| Czechs | 100.0 /100 | #31 | Exceptional 98.5% |
| French Canadians | 100.0 /100 | #32 | Exceptional 98.5% |
| Scandinavians | 100.0 /100 | #33 | Exceptional 98.5% |
| Swiss | 100.0 /100 | #34 | Exceptional 98.5% |
| Chinese | 100.0 /100 | #35 | Exceptional 98.5% |
| British | 100.0 /100 | #36 | Exceptional 98.5% |
| Italians | 99.9 /100 | #37 | Exceptional 98.5% |
| Chippewa | 99.9 /100 | #38 | Exceptional 98.5% |
| Latvians | 99.9 /100 | #39 | Exceptional 98.5% |
| Luxembourgers | 99.9 /100 | #40 | Exceptional 98.5% |
| Eastern Europeans | 99.9 /100 | #41 | Exceptional 98.5% |
Demographics Similar to Thais by 1st Grade
In terms of 1st grade, the demographic groups most similar to Thais are Okinawan (98.1%, a difference of 0.0%), Yugoslavian (98.2%, a difference of 0.010%), Immigrants from France (98.2%, a difference of 0.010%), Immigrants from Zimbabwe (98.1%, a difference of 0.010%), and Menominee (98.1%, a difference of 0.010%).
| Demographics | Rating | Rank | 1st Grade |
| Immigrants | Norway | 96.6 /100 | #112 | Exceptional 98.2% |
| Immigrants | Latvia | 96.4 /100 | #113 | Exceptional 98.2% |
| Ute | 96.2 /100 | #114 | Exceptional 98.2% |
| Iranians | 96.0 /100 | #115 | Exceptional 98.2% |
| Spanish | 95.9 /100 | #116 | Exceptional 98.2% |
| Yugoslavians | 95.5 /100 | #117 | Exceptional 98.2% |
| Immigrants | France | 95.5 /100 | #118 | Exceptional 98.2% |
| Thais | 94.7 /100 | #119 | Exceptional 98.1% |
| Okinawans | 94.5 /100 | #120 | Exceptional 98.1% |
| Immigrants | Zimbabwe | 94.0 /100 | #121 | Exceptional 98.1% |
| Menominee | 93.9 /100 | #122 | Exceptional 98.1% |
| Iroquois | 93.8 /100 | #123 | Exceptional 98.1% |
| Syrians | 93.7 /100 | #124 | Exceptional 98.1% |
| Immigrants | Japan | 93.7 /100 | #125 | Exceptional 98.1% |
| Lebanese | 93.5 /100 | #126 | Exceptional 98.1% |