Puget Sound Salish vs Immigrants from Belize 1st Grade
COMPARE
Puget Sound Salish
Immigrants from Belize
1st Grade
1st Grade Comparison
Puget Sound Salish
Immigrants from Belize
98.2%
1ST GRADE
98.2/ 100
METRIC RATING
99th/ 347
METRIC RANK
96.9%
1ST GRADE
0.0/ 100
METRIC RATING
315th/ 347
METRIC RANK
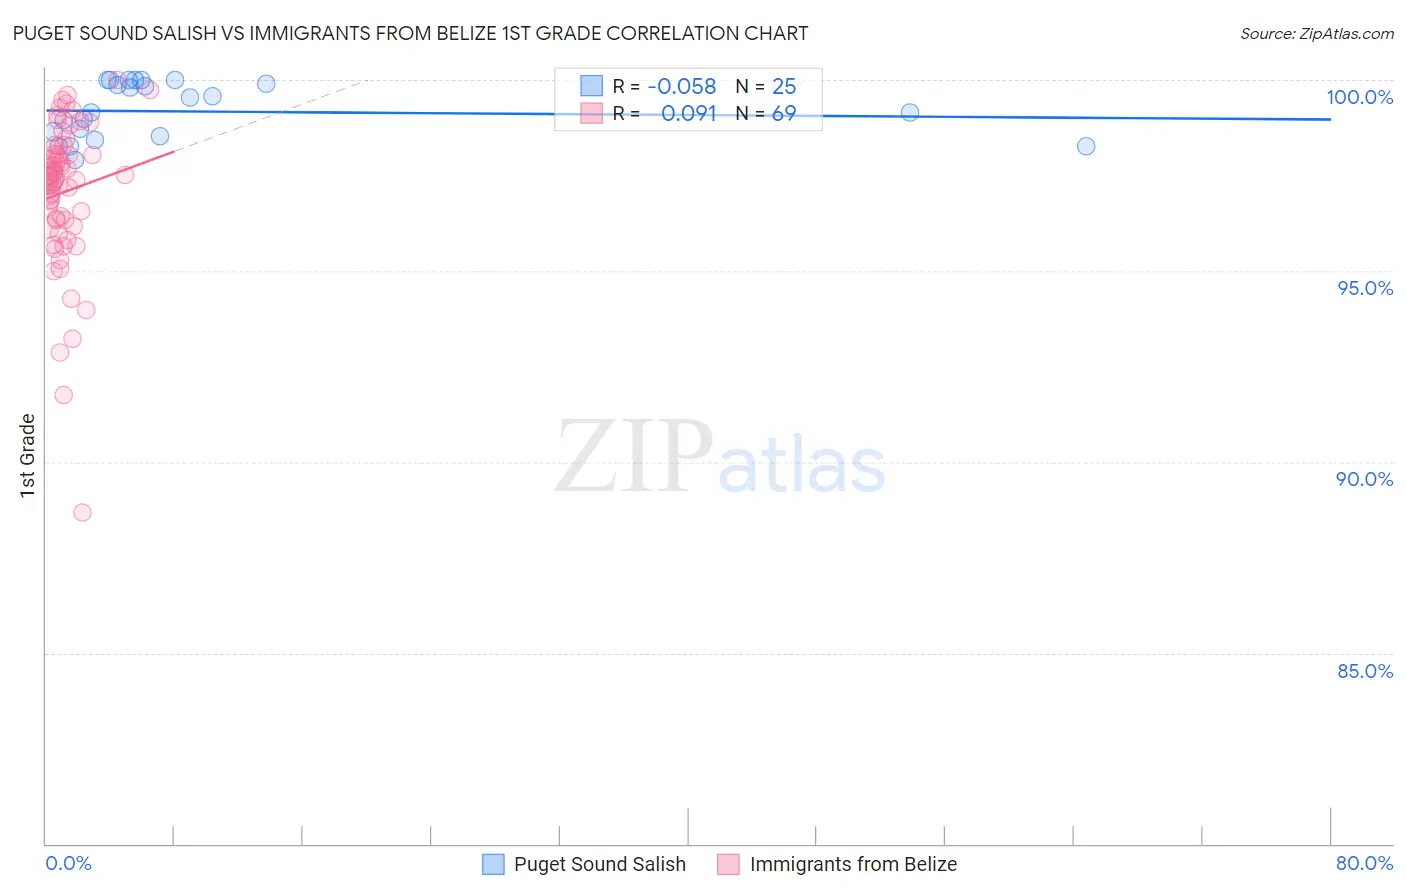
Puget Sound Salish vs Immigrants from Belize 1st Grade Correlation Chart
The statistical analysis conducted on geographies consisting of 46,155,746 people shows a slight negative correlation between the proportion of Puget Sound Salish and percentage of population with at least 1st grade education in the United States with a correlation coefficient (R) of -0.058 and weighted average of 98.2%. Similarly, the statistical analysis conducted on geographies consisting of 130,328,311 people shows a slight positive correlation between the proportion of Immigrants from Belize and percentage of population with at least 1st grade education in the United States with a correlation coefficient (R) of 0.091 and weighted average of 96.9%, a difference of 1.4%.
1st Grade Correlation Summary
| Measurement | Puget Sound Salish | Immigrants from Belize |
| Minimum | 97.4% | 88.7% |
| Maximum | 100.0% | 100.0% |
| Range | 2.6% | 11.3% |
| Mean | 99.2% | 97.1% |
| Median | 99.2% | 97.5% |
| Interquartile 25% (IQ1) | 98.5% | 96.2% |
| Interquartile 75% (IQ3) | 100.0% | 98.1% |
| Interquartile Range (IQR) | 1.5% | 1.9% |
| Standard Deviation (Sample) | 0.79% | 1.9% |
| Standard Deviation (Population) | 0.77% | 1.9% |
Similar Demographics by 1st Grade
Demographics Similar to Puget Sound Salish by 1st Grade
In terms of 1st grade, the demographic groups most similar to Puget Sound Salish are Cypriot (98.2%, a difference of 0.0%), Nonimmigrants (98.2%, a difference of 0.0%), Choctaw (98.2%, a difference of 0.0%), Immigrants from Germany (98.2%, a difference of 0.010%), and Colville (98.2%, a difference of 0.010%).
| Demographics | Rating | Rank | 1st Grade |
| Macedonians | 98.7 /100 | #92 | Exceptional 98.3% |
| Immigrants | India | 98.6 /100 | #93 | Exceptional 98.2% |
| South Africans | 98.6 /100 | #94 | Exceptional 98.2% |
| Immigrants | Germany | 98.5 /100 | #95 | Exceptional 98.2% |
| Cypriots | 98.3 /100 | #96 | Exceptional 98.2% |
| Immigrants | Nonimmigrants | 98.3 /100 | #97 | Exceptional 98.2% |
| Choctaw | 98.3 /100 | #98 | Exceptional 98.2% |
| Puget Sound Salish | 98.2 /100 | #99 | Exceptional 98.2% |
| Colville | 98.0 /100 | #100 | Exceptional 98.2% |
| Romanians | 97.8 /100 | #101 | Exceptional 98.2% |
| Cree | 97.8 /100 | #102 | Exceptional 98.2% |
| Immigrants | Ireland | 97.7 /100 | #103 | Exceptional 98.2% |
| Pima | 97.5 /100 | #104 | Exceptional 98.2% |
| Basques | 97.4 /100 | #105 | Exceptional 98.2% |
| Turks | 97.4 /100 | #106 | Exceptional 98.2% |
Demographics Similar to Immigrants from Belize by 1st Grade
In terms of 1st grade, the demographic groups most similar to Immigrants from Belize are Honduran (96.9%, a difference of 0.010%), Immigrants from Ecuador (96.9%, a difference of 0.010%), Immigrants from Nicaragua (96.9%, a difference of 0.010%), Cape Verdean (96.9%, a difference of 0.030%), and Guyanese (96.9%, a difference of 0.030%).
| Demographics | Rating | Rank | 1st Grade |
| Hispanics or Latinos | 0.0 /100 | #308 | Tragic 96.9% |
| Immigrants | Haiti | 0.0 /100 | #309 | Tragic 96.9% |
| Immigrants | Azores | 0.0 /100 | #310 | Tragic 96.9% |
| Sri Lankans | 0.0 /100 | #311 | Tragic 96.9% |
| Cape Verdeans | 0.0 /100 | #312 | Tragic 96.9% |
| Guyanese | 0.0 /100 | #313 | Tragic 96.9% |
| Hondurans | 0.0 /100 | #314 | Tragic 96.9% |
| Immigrants | Belize | 0.0 /100 | #315 | Tragic 96.9% |
| Immigrants | Ecuador | 0.0 /100 | #316 | Tragic 96.9% |
| Immigrants | Nicaragua | 0.0 /100 | #317 | Tragic 96.9% |
| Immigrants | Laos | 0.0 /100 | #318 | Tragic 96.8% |
| Immigrants | Guyana | 0.0 /100 | #319 | Tragic 96.8% |
| Immigrants | Burma/Myanmar | 0.0 /100 | #320 | Tragic 96.8% |
| Immigrants | Bangladesh | 0.0 /100 | #321 | Tragic 96.8% |
| Mexican American Indians | 0.0 /100 | #322 | Tragic 96.8% |