Puget Sound Salish vs Guatemalan 6th Grade
COMPARE
Puget Sound Salish
Guatemalan
6th Grade
6th Grade Comparison
Puget Sound Salish
Guatemalans
97.5%
6TH GRADE
98.9/ 100
METRIC RATING
87th/ 347
METRIC RANK
94.2%
6TH GRADE
0.0/ 100
METRIC RATING
340th/ 347
METRIC RANK
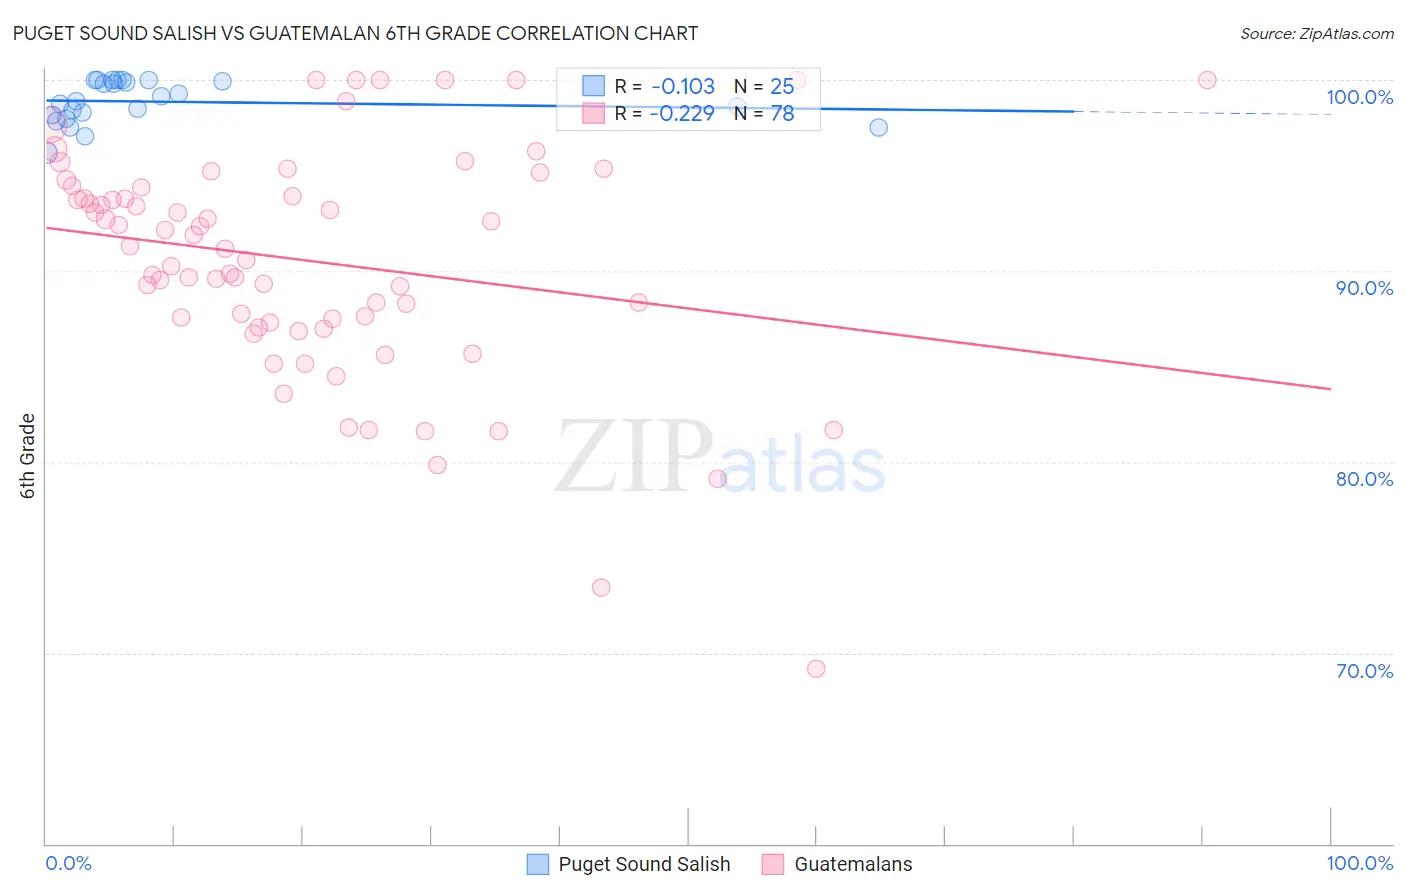
Puget Sound Salish vs Guatemalan 6th Grade Correlation Chart
The statistical analysis conducted on geographies consisting of 46,155,746 people shows a poor negative correlation between the proportion of Puget Sound Salish and percentage of population with at least 6th grade education in the United States with a correlation coefficient (R) of -0.103 and weighted average of 97.5%. Similarly, the statistical analysis conducted on geographies consisting of 409,566,469 people shows a weak negative correlation between the proportion of Guatemalans and percentage of population with at least 6th grade education in the United States with a correlation coefficient (R) of -0.229 and weighted average of 94.2%, a difference of 3.5%.
6th Grade Correlation Summary
| Measurement | Puget Sound Salish | Guatemalan |
| Minimum | 96.2% | 69.2% |
| Maximum | 100.0% | 100.0% |
| Range | 3.8% | 30.8% |
| Mean | 98.9% | 90.5% |
| Median | 98.9% | 91.2% |
| Interquartile 25% (IQ1) | 98.1% | 87.3% |
| Interquartile 75% (IQ3) | 100.0% | 94.4% |
| Interquartile Range (IQR) | 1.9% | 7.1% |
| Standard Deviation (Sample) | 1.1% | 6.1% |
| Standard Deviation (Population) | 1.1% | 6.0% |
Similar Demographics by 6th Grade
Demographics Similar to Puget Sound Salish by 6th Grade
In terms of 6th grade, the demographic groups most similar to Puget Sound Salish are Immigrants from Belgium (97.5%, a difference of 0.0%), Immigrants from South Africa (97.5%, a difference of 0.0%), Immigrants from Australia (97.5%, a difference of 0.0%), Delaware (97.6%, a difference of 0.010%), and Pueblo (97.5%, a difference of 0.010%).
| Demographics | Rating | Rank | 6th Grade |
| Osage | 99.3 /100 | #80 | Exceptional 97.6% |
| Lumbee | 99.2 /100 | #81 | Exceptional 97.6% |
| Zimbabweans | 99.1 /100 | #82 | Exceptional 97.6% |
| Potawatomi | 99.1 /100 | #83 | Exceptional 97.6% |
| Shoshone | 99.0 /100 | #84 | Exceptional 97.6% |
| Delaware | 98.9 /100 | #85 | Exceptional 97.6% |
| Immigrants | Belgium | 98.9 /100 | #86 | Exceptional 97.5% |
| Puget Sound Salish | 98.9 /100 | #87 | Exceptional 97.5% |
| Immigrants | South Africa | 98.9 /100 | #88 | Exceptional 97.5% |
| Immigrants | Australia | 98.8 /100 | #89 | Exceptional 97.5% |
| Pueblo | 98.8 /100 | #90 | Exceptional 97.5% |
| Immigrants | Western Europe | 98.8 /100 | #91 | Exceptional 97.5% |
| Romanians | 98.7 /100 | #92 | Exceptional 97.5% |
| Cree | 98.7 /100 | #93 | Exceptional 97.5% |
| Cypriots | 98.7 /100 | #94 | Exceptional 97.5% |
Demographics Similar to Guatemalans by 6th Grade
In terms of 6th grade, the demographic groups most similar to Guatemalans are Yakama (94.3%, a difference of 0.11%), Immigrants from Yemen (94.1%, a difference of 0.11%), Immigrants from Central America (94.0%, a difference of 0.22%), Central American (94.5%, a difference of 0.26%), and Immigrants from Cabo Verde (94.4%, a difference of 0.26%).
| Demographics | Rating | Rank | 6th Grade |
| Immigrants | Latin America | 0.0 /100 | #333 | Tragic 94.7% |
| Immigrants | Azores | 0.0 /100 | #334 | Tragic 94.7% |
| Mexicans | 0.0 /100 | #335 | Tragic 94.6% |
| Immigrants | Dominican Republic | 0.0 /100 | #336 | Tragic 94.6% |
| Central Americans | 0.0 /100 | #337 | Tragic 94.5% |
| Immigrants | Cabo Verde | 0.0 /100 | #338 | Tragic 94.4% |
| Yakama | 0.0 /100 | #339 | Tragic 94.3% |
| Guatemalans | 0.0 /100 | #340 | Tragic 94.2% |
| Immigrants | Yemen | 0.0 /100 | #341 | Tragic 94.1% |
| Immigrants | Central America | 0.0 /100 | #342 | Tragic 94.0% |
| Immigrants | Mexico | 0.0 /100 | #343 | Tragic 93.9% |
| Immigrants | Guatemala | 0.0 /100 | #344 | Tragic 93.9% |
| Salvadorans | 0.0 /100 | #345 | Tragic 93.9% |
| Spanish American Indians | 0.0 /100 | #346 | Tragic 93.6% |
| Immigrants | El Salvador | 0.0 /100 | #347 | Tragic 93.6% |