Puget Sound Salish vs Immigrants from Indonesia 6th Grade
COMPARE
Puget Sound Salish
Immigrants from Indonesia
6th Grade
6th Grade Comparison
Puget Sound Salish
Immigrants from Indonesia
97.5%
6TH GRADE
98.9/ 100
METRIC RATING
87th/ 347
METRIC RANK
96.6%
6TH GRADE
2.3/ 100
METRIC RATING
236th/ 347
METRIC RANK
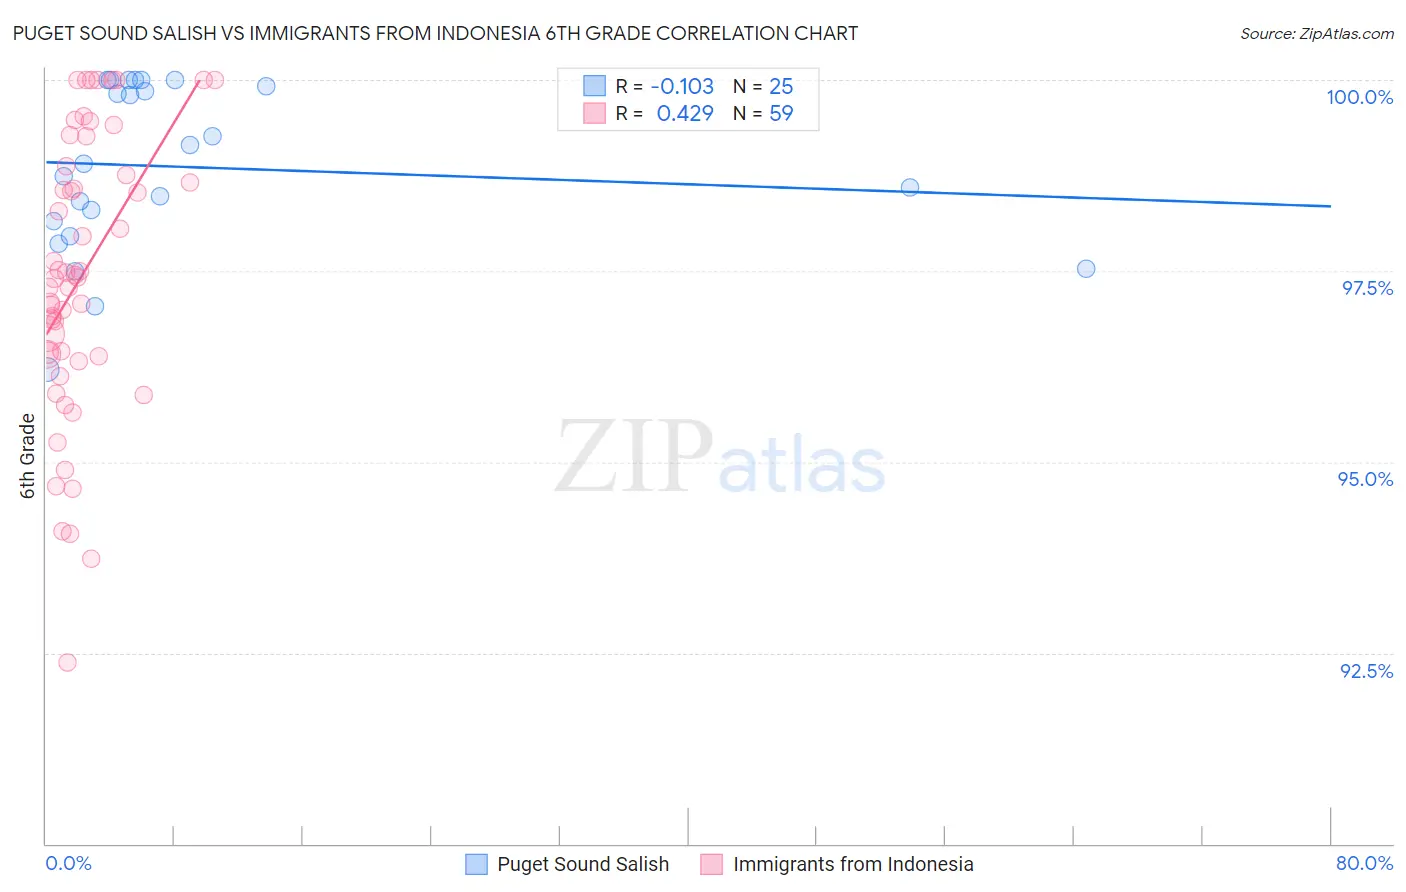
Puget Sound Salish vs Immigrants from Indonesia 6th Grade Correlation Chart
The statistical analysis conducted on geographies consisting of 46,155,746 people shows a poor negative correlation between the proportion of Puget Sound Salish and percentage of population with at least 6th grade education in the United States with a correlation coefficient (R) of -0.103 and weighted average of 97.5%. Similarly, the statistical analysis conducted on geographies consisting of 215,782,971 people shows a moderate positive correlation between the proportion of Immigrants from Indonesia and percentage of population with at least 6th grade education in the United States with a correlation coefficient (R) of 0.429 and weighted average of 96.6%, a difference of 0.94%.
6th Grade Correlation Summary
| Measurement | Puget Sound Salish | Immigrants from Indonesia |
| Minimum | 96.2% | 92.4% |
| Maximum | 100.0% | 100.0% |
| Range | 3.8% | 7.6% |
| Mean | 98.9% | 97.4% |
| Median | 98.9% | 97.4% |
| Interquartile 25% (IQ1) | 98.1% | 96.4% |
| Interquartile 75% (IQ3) | 100.0% | 98.9% |
| Interquartile Range (IQR) | 1.9% | 2.5% |
| Standard Deviation (Sample) | 1.1% | 1.8% |
| Standard Deviation (Population) | 1.1% | 1.8% |
Similar Demographics by 6th Grade
Demographics Similar to Puget Sound Salish by 6th Grade
In terms of 6th grade, the demographic groups most similar to Puget Sound Salish are Immigrants from Belgium (97.5%, a difference of 0.0%), Immigrants from South Africa (97.5%, a difference of 0.0%), Immigrants from Australia (97.5%, a difference of 0.0%), Delaware (97.6%, a difference of 0.010%), and Pueblo (97.5%, a difference of 0.010%).
| Demographics | Rating | Rank | 6th Grade |
| Osage | 99.3 /100 | #80 | Exceptional 97.6% |
| Lumbee | 99.2 /100 | #81 | Exceptional 97.6% |
| Zimbabweans | 99.1 /100 | #82 | Exceptional 97.6% |
| Potawatomi | 99.1 /100 | #83 | Exceptional 97.6% |
| Shoshone | 99.0 /100 | #84 | Exceptional 97.6% |
| Delaware | 98.9 /100 | #85 | Exceptional 97.6% |
| Immigrants | Belgium | 98.9 /100 | #86 | Exceptional 97.5% |
| Puget Sound Salish | 98.9 /100 | #87 | Exceptional 97.5% |
| Immigrants | South Africa | 98.9 /100 | #88 | Exceptional 97.5% |
| Immigrants | Australia | 98.8 /100 | #89 | Exceptional 97.5% |
| Pueblo | 98.8 /100 | #90 | Exceptional 97.5% |
| Immigrants | Western Europe | 98.8 /100 | #91 | Exceptional 97.5% |
| Romanians | 98.7 /100 | #92 | Exceptional 97.5% |
| Cree | 98.7 /100 | #93 | Exceptional 97.5% |
| Cypriots | 98.7 /100 | #94 | Exceptional 97.5% |
Demographics Similar to Immigrants from Indonesia by 6th Grade
In terms of 6th grade, the demographic groups most similar to Immigrants from Indonesia are Uruguayan (96.6%, a difference of 0.010%), Asian (96.6%, a difference of 0.010%), Immigrants from Eastern Africa (96.6%, a difference of 0.010%), Nigerian (96.6%, a difference of 0.020%), and Indian (Asian) (96.6%, a difference of 0.020%).
| Demographics | Rating | Rank | 6th Grade |
| Assyrians/Chaldeans/Syriacs | 4.0 /100 | #229 | Tragic 96.7% |
| Immigrants | Eastern Asia | 4.0 /100 | #230 | Tragic 96.7% |
| Sub-Saharan Africans | 3.5 /100 | #231 | Tragic 96.7% |
| South American Indians | 3.5 /100 | #232 | Tragic 96.7% |
| Yuman | 3.2 /100 | #233 | Tragic 96.7% |
| Uruguayans | 2.5 /100 | #234 | Tragic 96.6% |
| Asians | 2.4 /100 | #235 | Tragic 96.6% |
| Immigrants | Indonesia | 2.3 /100 | #236 | Tragic 96.6% |
| Immigrants | Eastern Africa | 2.0 /100 | #237 | Tragic 96.6% |
| Nigerians | 1.9 /100 | #238 | Tragic 96.6% |
| Indians (Asian) | 1.9 /100 | #239 | Tragic 96.6% |
| Koreans | 1.9 /100 | #240 | Tragic 96.6% |
| Senegalese | 1.8 /100 | #241 | Tragic 96.6% |
| Immigrants | Asia | 1.8 /100 | #242 | Tragic 96.6% |
| Immigrants | Liberia | 1.6 /100 | #243 | Tragic 96.6% |