Puget Sound Salish vs Slavic 6th Grade
COMPARE
Puget Sound Salish
Slavic
6th Grade
6th Grade Comparison
Puget Sound Salish
Slavs
97.5%
6TH GRADE
98.9/ 100
METRIC RATING
87th/ 347
METRIC RANK
97.8%
6TH GRADE
99.8/ 100
METRIC RATING
53rd/ 347
METRIC RANK
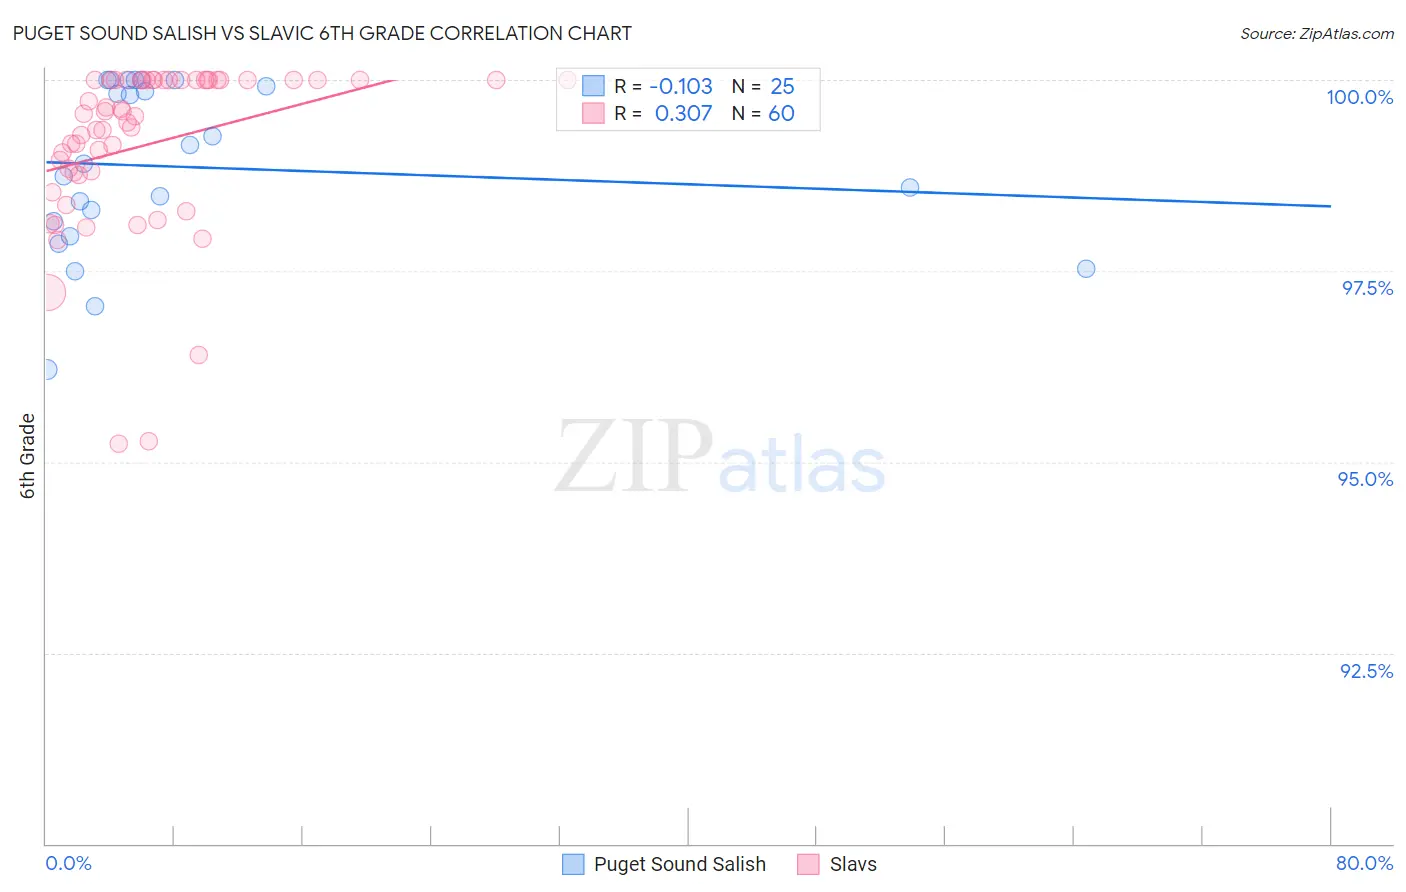
Puget Sound Salish vs Slavic 6th Grade Correlation Chart
The statistical analysis conducted on geographies consisting of 46,155,746 people shows a poor negative correlation between the proportion of Puget Sound Salish and percentage of population with at least 6th grade education in the United States with a correlation coefficient (R) of -0.103 and weighted average of 97.5%. Similarly, the statistical analysis conducted on geographies consisting of 270,869,056 people shows a mild positive correlation between the proportion of Slavs and percentage of population with at least 6th grade education in the United States with a correlation coefficient (R) of 0.307 and weighted average of 97.8%, a difference of 0.22%.
6th Grade Correlation Summary
| Measurement | Puget Sound Salish | Slavic |
| Minimum | 96.2% | 95.2% |
| Maximum | 100.0% | 100.0% |
| Range | 3.8% | 4.8% |
| Mean | 98.9% | 99.2% |
| Median | 98.9% | 99.5% |
| Interquartile 25% (IQ1) | 98.1% | 98.8% |
| Interquartile 75% (IQ3) | 100.0% | 100.0% |
| Interquartile Range (IQR) | 1.9% | 1.2% |
| Standard Deviation (Sample) | 1.1% | 1.1% |
| Standard Deviation (Population) | 1.1% | 1.1% |
Similar Demographics by 6th Grade
Demographics Similar to Puget Sound Salish by 6th Grade
In terms of 6th grade, the demographic groups most similar to Puget Sound Salish are Immigrants from Belgium (97.5%, a difference of 0.0%), Immigrants from South Africa (97.5%, a difference of 0.0%), Immigrants from Australia (97.5%, a difference of 0.0%), Delaware (97.6%, a difference of 0.010%), and Pueblo (97.5%, a difference of 0.010%).
| Demographics | Rating | Rank | 6th Grade |
| Osage | 99.3 /100 | #80 | Exceptional 97.6% |
| Lumbee | 99.2 /100 | #81 | Exceptional 97.6% |
| Zimbabweans | 99.1 /100 | #82 | Exceptional 97.6% |
| Potawatomi | 99.1 /100 | #83 | Exceptional 97.6% |
| Shoshone | 99.0 /100 | #84 | Exceptional 97.6% |
| Delaware | 98.9 /100 | #85 | Exceptional 97.6% |
| Immigrants | Belgium | 98.9 /100 | #86 | Exceptional 97.5% |
| Puget Sound Salish | 98.9 /100 | #87 | Exceptional 97.5% |
| Immigrants | South Africa | 98.9 /100 | #88 | Exceptional 97.5% |
| Immigrants | Australia | 98.8 /100 | #89 | Exceptional 97.5% |
| Pueblo | 98.8 /100 | #90 | Exceptional 97.5% |
| Immigrants | Western Europe | 98.8 /100 | #91 | Exceptional 97.5% |
| Romanians | 98.7 /100 | #92 | Exceptional 97.5% |
| Cree | 98.7 /100 | #93 | Exceptional 97.5% |
| Cypriots | 98.7 /100 | #94 | Exceptional 97.5% |
Demographics Similar to Slavs by 6th Grade
In terms of 6th grade, the demographic groups most similar to Slavs are Maltese (97.8%, a difference of 0.0%), Australian (97.8%, a difference of 0.0%), Celtic (97.8%, a difference of 0.010%), Estonian (97.8%, a difference of 0.010%), and Immigrants from Scotland (97.8%, a difference of 0.010%).
| Demographics | Rating | Rank | 6th Grade |
| Arapaho | 99.9 /100 | #46 | Exceptional 97.8% |
| Native Hawaiians | 99.9 /100 | #47 | Exceptional 97.8% |
| Celtics | 99.9 /100 | #48 | Exceptional 97.8% |
| Estonians | 99.8 /100 | #49 | Exceptional 97.8% |
| Immigrants | Scotland | 99.8 /100 | #50 | Exceptional 97.8% |
| Maltese | 99.8 /100 | #51 | Exceptional 97.8% |
| Australians | 99.8 /100 | #52 | Exceptional 97.8% |
| Slavs | 99.8 /100 | #53 | Exceptional 97.8% |
| Creek | 99.8 /100 | #54 | Exceptional 97.7% |
| Aleuts | 99.8 /100 | #55 | Exceptional 97.7% |
| Austrians | 99.8 /100 | #56 | Exceptional 97.7% |
| Whites/Caucasians | 99.8 /100 | #57 | Exceptional 97.7% |
| Greeks | 99.8 /100 | #58 | Exceptional 97.7% |
| Americans | 99.8 /100 | #59 | Exceptional 97.7% |
| Immigrants | Canada | 99.8 /100 | #60 | Exceptional 97.7% |