Puget Sound Salish vs Immigrants from Trinidad and Tobago Nursery School
COMPARE
Puget Sound Salish
Immigrants from Trinidad and Tobago
Nursery School
Nursery School Comparison
Puget Sound Salish
Immigrants from Trinidad and Tobago
98.3%
NURSERY SCHOOL
98.0/ 100
METRIC RATING
100th/ 347
METRIC RANK
97.4%
NURSERY SCHOOL
0.0/ 100
METRIC RATING
284th/ 347
METRIC RANK
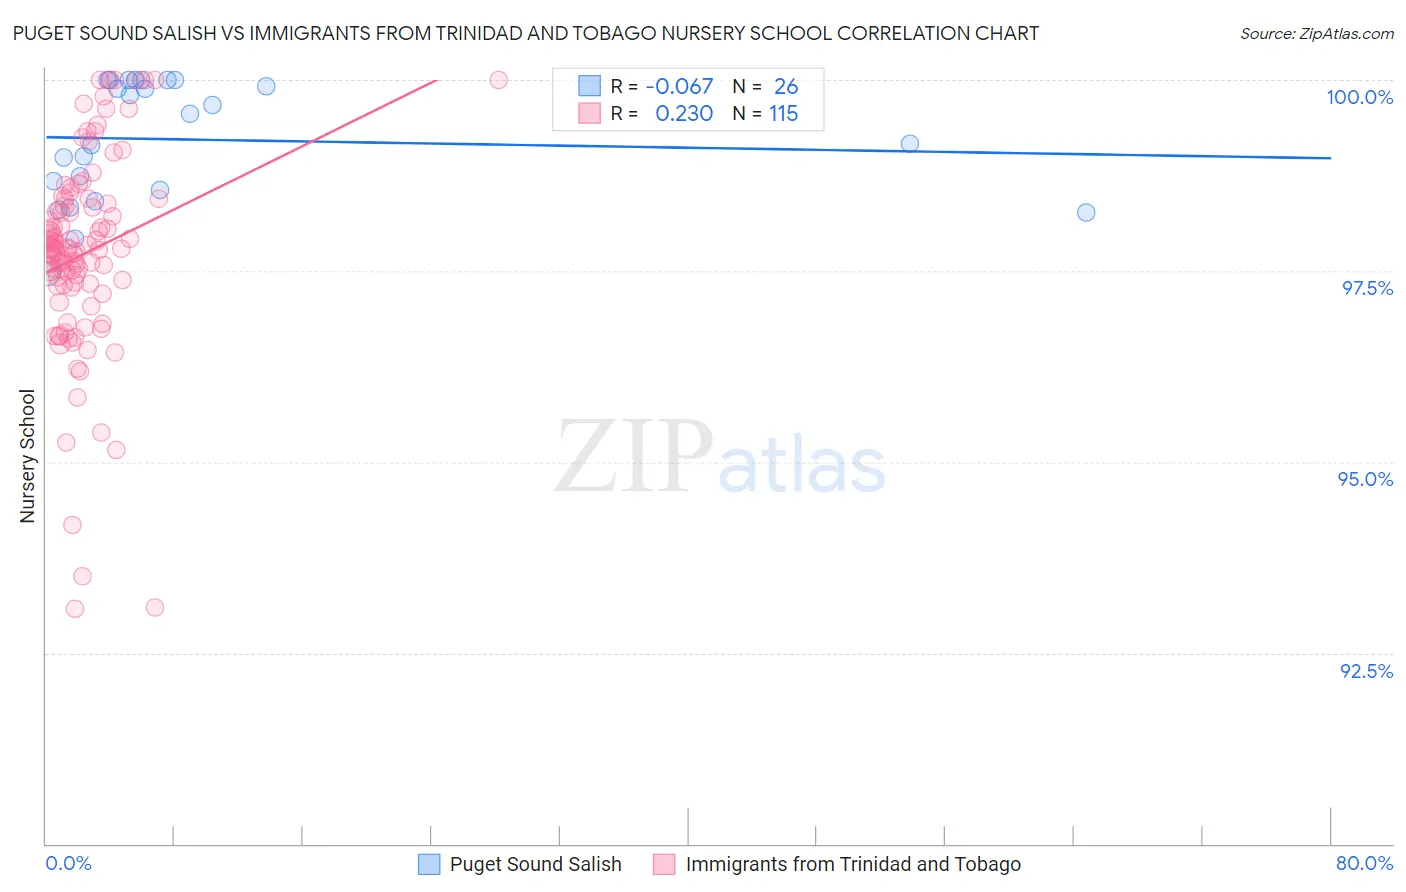
Puget Sound Salish vs Immigrants from Trinidad and Tobago Nursery School Correlation Chart
The statistical analysis conducted on geographies consisting of 46,155,865 people shows a slight negative correlation between the proportion of Puget Sound Salish and percentage of population with at least nursery school education in the United States with a correlation coefficient (R) of -0.067 and weighted average of 98.3%. Similarly, the statistical analysis conducted on geographies consisting of 223,545,304 people shows a weak positive correlation between the proportion of Immigrants from Trinidad and Tobago and percentage of population with at least nursery school education in the United States with a correlation coefficient (R) of 0.230 and weighted average of 97.4%, a difference of 0.91%.
Nursery School Correlation Summary
| Measurement | Puget Sound Salish | Immigrants from Trinidad and Tobago |
| Minimum | 97.5% | 93.1% |
| Maximum | 100.0% | 100.0% |
| Range | 2.5% | 6.9% |
| Mean | 99.2% | 97.7% |
| Median | 99.4% | 97.8% |
| Interquartile 25% (IQ1) | 98.6% | 97.3% |
| Interquartile 75% (IQ3) | 100.0% | 98.4% |
| Interquartile Range (IQR) | 1.4% | 1.1% |
| Standard Deviation (Sample) | 0.78% | 1.3% |
| Standard Deviation (Population) | 0.76% | 1.3% |
Similar Demographics by Nursery School
Demographics Similar to Puget Sound Salish by Nursery School
In terms of nursery school, the demographic groups most similar to Puget Sound Salish are Romanian (98.3%, a difference of 0.0%), Choctaw (98.3%, a difference of 0.010%), Colville (98.3%, a difference of 0.010%), Immigrants from Ireland (98.3%, a difference of 0.010%), and Cree (98.3%, a difference of 0.010%).
| Demographics | Rating | Rank | Nursery School |
| Immigrants | India | 98.7 /100 | #93 | Exceptional 98.3% |
| Immigrants | Germany | 98.6 /100 | #94 | Exceptional 98.3% |
| South Africans | 98.6 /100 | #95 | Exceptional 98.3% |
| Cypriots | 98.3 /100 | #96 | Exceptional 98.3% |
| Immigrants | Nonimmigrants | 98.3 /100 | #97 | Exceptional 98.3% |
| Choctaw | 98.3 /100 | #98 | Exceptional 98.3% |
| Colville | 98.2 /100 | #99 | Exceptional 98.3% |
| Puget Sound Salish | 98.0 /100 | #100 | Exceptional 98.3% |
| Romanians | 97.9 /100 | #101 | Exceptional 98.3% |
| Immigrants | Ireland | 97.7 /100 | #102 | Exceptional 98.3% |
| Cree | 97.7 /100 | #103 | Exceptional 98.3% |
| Bhutanese | 97.4 /100 | #104 | Exceptional 98.2% |
| Turks | 97.4 /100 | #105 | Exceptional 98.2% |
| Immigrants | Switzerland | 97.3 /100 | #106 | Exceptional 98.2% |
| Basques | 97.3 /100 | #107 | Exceptional 98.2% |
Demographics Similar to Immigrants from Trinidad and Tobago by Nursery School
In terms of nursery school, the demographic groups most similar to Immigrants from Trinidad and Tobago are Immigrants from West Indies (97.4%, a difference of 0.0%), Immigrants from Barbados (97.4%, a difference of 0.020%), Immigrants from Portugal (97.4%, a difference of 0.020%), Immigrants from Hong Kong (97.4%, a difference of 0.030%), and Barbadian (97.4%, a difference of 0.040%).
| Demographics | Rating | Rank | Nursery School |
| Immigrants | Western Africa | 0.1 /100 | #277 | Tragic 97.4% |
| Immigrants | Uzbekistan | 0.1 /100 | #278 | Tragic 97.4% |
| Immigrants | Ghana | 0.1 /100 | #279 | Tragic 97.4% |
| Barbadians | 0.0 /100 | #280 | Tragic 97.4% |
| Trinidadians and Tobagonians | 0.0 /100 | #281 | Tragic 97.4% |
| Afghans | 0.0 /100 | #282 | Tragic 97.4% |
| Immigrants | West Indies | 0.0 /100 | #283 | Tragic 97.4% |
| Immigrants | Trinidad and Tobago | 0.0 /100 | #284 | Tragic 97.4% |
| Immigrants | Barbados | 0.0 /100 | #285 | Tragic 97.4% |
| Immigrants | Portugal | 0.0 /100 | #286 | Tragic 97.4% |
| Immigrants | Hong Kong | 0.0 /100 | #287 | Tragic 97.4% |
| Immigrants | Thailand | 0.0 /100 | #288 | Tragic 97.3% |
| Immigrants | St. Vincent and the Grenadines | 0.0 /100 | #289 | Tragic 97.3% |
| Immigrants | Afghanistan | 0.0 /100 | #290 | Tragic 97.3% |
| British West Indians | 0.0 /100 | #291 | Tragic 97.3% |