Puget Sound Salish vs Immigrants from Trinidad and Tobago Poverty
COMPARE
Puget Sound Salish
Immigrants from Trinidad and Tobago
Poverty
Poverty Comparison
Puget Sound Salish
Immigrants from Trinidad and Tobago
11.7%
POVERTY
88.7/ 100
METRIC RATING
122nd/ 347
METRIC RANK
14.2%
POVERTY
0.2/ 100
METRIC RATING
253rd/ 347
METRIC RANK
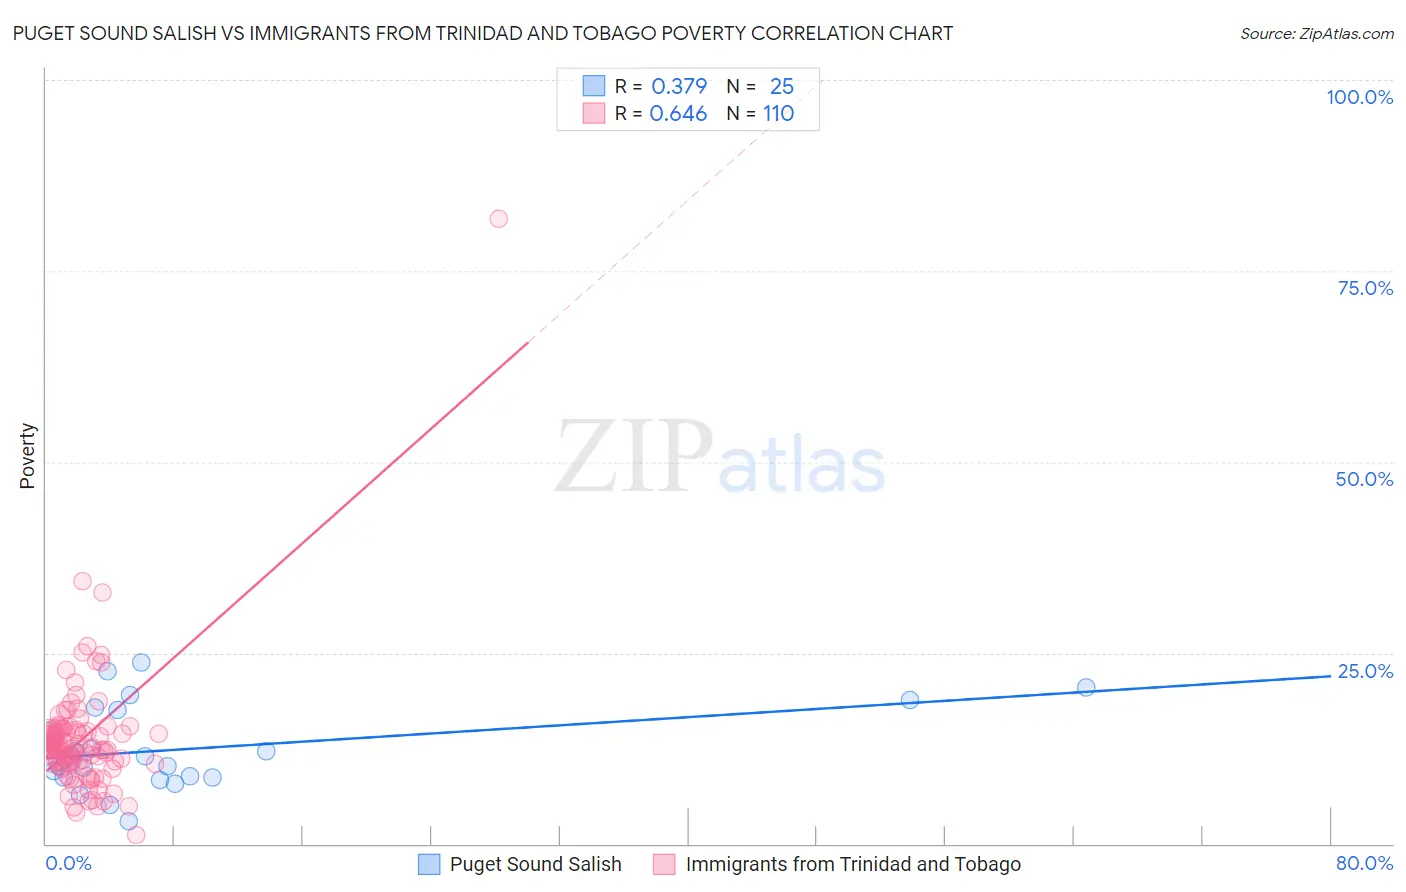
Puget Sound Salish vs Immigrants from Trinidad and Tobago Poverty Correlation Chart
The statistical analysis conducted on geographies consisting of 46,150,573 people shows a mild positive correlation between the proportion of Puget Sound Salish and poverty level in the United States with a correlation coefficient (R) of 0.379 and weighted average of 11.7%. Similarly, the statistical analysis conducted on geographies consisting of 223,476,613 people shows a significant positive correlation between the proportion of Immigrants from Trinidad and Tobago and poverty level in the United States with a correlation coefficient (R) of 0.646 and weighted average of 14.2%, a difference of 21.7%.
Poverty Correlation Summary
| Measurement | Puget Sound Salish | Immigrants from Trinidad and Tobago |
| Minimum | 3.0% | 1.1% |
| Maximum | 23.7% | 81.9% |
| Range | 20.7% | 80.8% |
| Mean | 12.4% | 13.7% |
| Median | 11.4% | 12.5% |
| Interquartile 25% (IQ1) | 8.7% | 10.6% |
| Interquartile 75% (IQ3) | 17.7% | 14.9% |
| Interquartile Range (IQR) | 9.0% | 4.3% |
| Standard Deviation (Sample) | 5.5% | 8.4% |
| Standard Deviation (Population) | 5.4% | 8.4% |
Similar Demographics by Poverty
Demographics Similar to Puget Sound Salish by Poverty
In terms of poverty, the demographic groups most similar to Puget Sound Salish are New Zealander (11.7%, a difference of 0.0%), Immigrants from Hungary (11.7%, a difference of 0.020%), Immigrants from South Eastern Asia (11.7%, a difference of 0.060%), Tlingit-Haida (11.7%, a difference of 0.070%), and Soviet Union (11.7%, a difference of 0.090%).
| Demographics | Rating | Rank | Poverty |
| Albanians | 90.3 /100 | #115 | Exceptional 11.7% |
| Immigrants | Russia | 89.7 /100 | #116 | Excellent 11.7% |
| Sri Lankans | 89.4 /100 | #117 | Excellent 11.7% |
| Argentineans | 89.1 /100 | #118 | Excellent 11.7% |
| Tlingit-Haida | 89.0 /100 | #119 | Excellent 11.7% |
| Immigrants | South Eastern Asia | 88.9 /100 | #120 | Excellent 11.7% |
| New Zealanders | 88.7 /100 | #121 | Excellent 11.7% |
| Puget Sound Salish | 88.7 /100 | #122 | Excellent 11.7% |
| Immigrants | Hungary | 88.6 /100 | #123 | Excellent 11.7% |
| Soviet Union | 88.4 /100 | #124 | Excellent 11.7% |
| Immigrants | Brazil | 88.2 /100 | #125 | Excellent 11.7% |
| Immigrants | Norway | 88.0 /100 | #126 | Excellent 11.7% |
| Immigrants | Argentina | 88.0 /100 | #127 | Excellent 11.7% |
| Immigrants | Israel | 87.4 /100 | #128 | Excellent 11.7% |
| South Africans | 87.0 /100 | #129 | Excellent 11.7% |
Demographics Similar to Immigrants from Trinidad and Tobago by Poverty
In terms of poverty, the demographic groups most similar to Immigrants from Trinidad and Tobago are Spanish American Indian (14.2%, a difference of 0.10%), Immigrants from Burma/Myanmar (14.2%, a difference of 0.22%), Immigrants from El Salvador (14.3%, a difference of 0.25%), Cree (14.2%, a difference of 0.31%), and Immigrants from Ecuador (14.3%, a difference of 0.35%).
| Demographics | Rating | Rank | Poverty |
| Potawatomi | 0.3 /100 | #246 | Tragic 14.1% |
| Liberians | 0.2 /100 | #247 | Tragic 14.1% |
| Immigrants | Western Africa | 0.2 /100 | #248 | Tragic 14.1% |
| Immigrants | Ghana | 0.2 /100 | #249 | Tragic 14.2% |
| Cree | 0.2 /100 | #250 | Tragic 14.2% |
| Immigrants | Burma/Myanmar | 0.2 /100 | #251 | Tragic 14.2% |
| Spanish American Indians | 0.2 /100 | #252 | Tragic 14.2% |
| Immigrants | Trinidad and Tobago | 0.2 /100 | #253 | Tragic 14.2% |
| Immigrants | El Salvador | 0.1 /100 | #254 | Tragic 14.3% |
| Immigrants | Ecuador | 0.1 /100 | #255 | Tragic 14.3% |
| Mexican American Indians | 0.1 /100 | #256 | Tragic 14.3% |
| Trinidadians and Tobagonians | 0.1 /100 | #257 | Tragic 14.3% |
| Ottawa | 0.1 /100 | #258 | Tragic 14.3% |
| Immigrants | Nicaragua | 0.1 /100 | #259 | Tragic 14.3% |
| Cape Verdeans | 0.1 /100 | #260 | Tragic 14.4% |