Puget Sound Salish vs Immigrants from Mexico Nursery School
COMPARE
Puget Sound Salish
Immigrants from Mexico
Nursery School
Nursery School Comparison
Puget Sound Salish
Immigrants from Mexico
98.3%
NURSERY SCHOOL
98.0/ 100
METRIC RATING
100th/ 347
METRIC RANK
96.4%
NURSERY SCHOOL
0.0/ 100
METRIC RATING
342nd/ 347
METRIC RANK
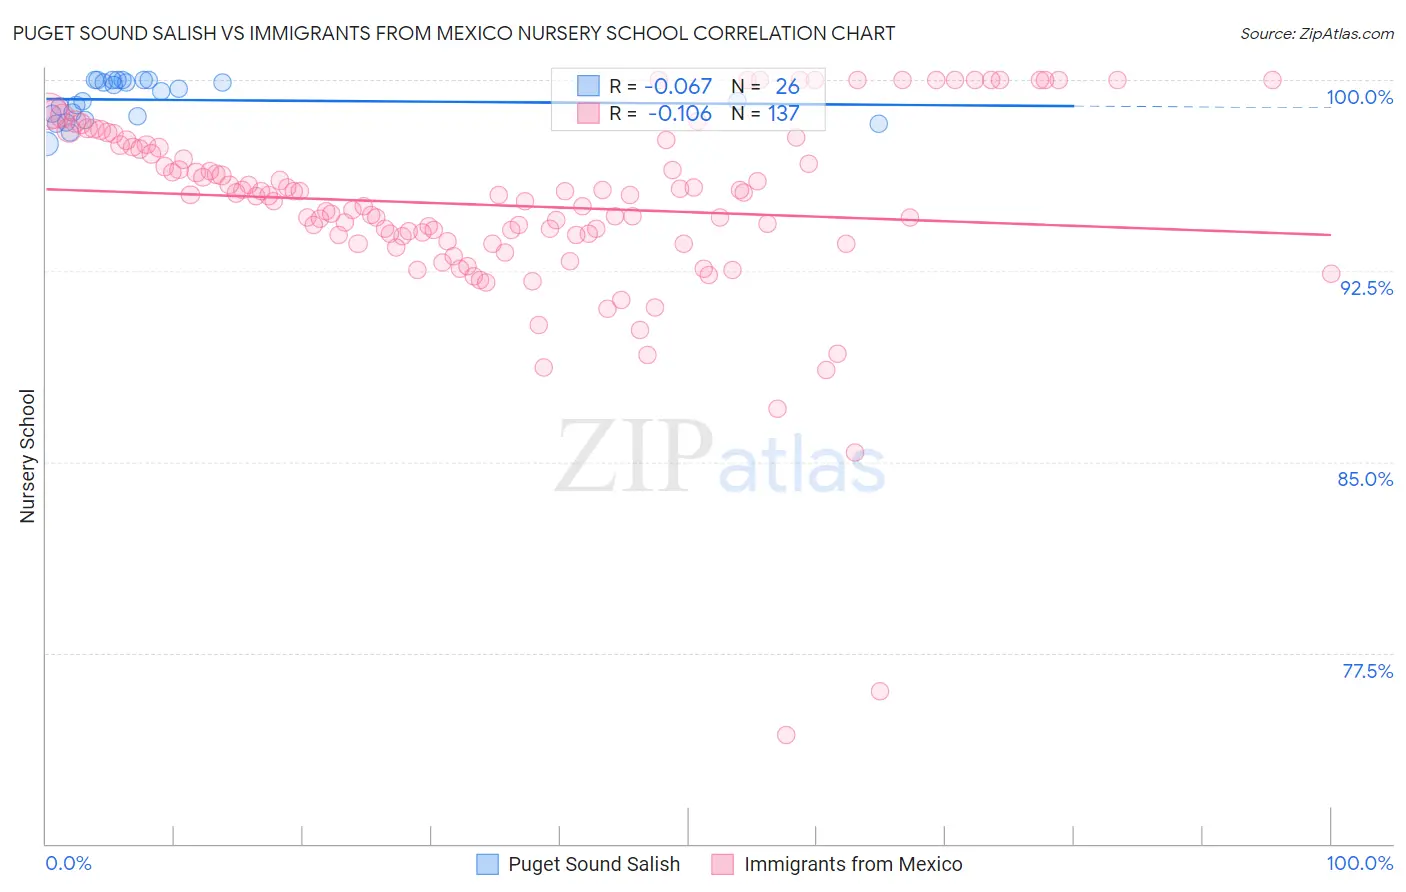
Puget Sound Salish vs Immigrants from Mexico Nursery School Correlation Chart
The statistical analysis conducted on geographies consisting of 46,155,865 people shows a slight negative correlation between the proportion of Puget Sound Salish and percentage of population with at least nursery school education in the United States with a correlation coefficient (R) of -0.067 and weighted average of 98.3%. Similarly, the statistical analysis conducted on geographies consisting of 513,767,418 people shows a poor negative correlation between the proportion of Immigrants from Mexico and percentage of population with at least nursery school education in the United States with a correlation coefficient (R) of -0.106 and weighted average of 96.4%, a difference of 1.9%.
Nursery School Correlation Summary
| Measurement | Puget Sound Salish | Immigrants from Mexico |
| Minimum | 97.5% | 74.3% |
| Maximum | 100.0% | 100.0% |
| Range | 2.5% | 25.7% |
| Mean | 99.2% | 95.1% |
| Median | 99.4% | 95.5% |
| Interquartile 25% (IQ1) | 98.6% | 93.8% |
| Interquartile 75% (IQ3) | 100.0% | 97.4% |
| Interquartile Range (IQR) | 1.4% | 3.6% |
| Standard Deviation (Sample) | 0.78% | 3.8% |
| Standard Deviation (Population) | 0.76% | 3.8% |
Similar Demographics by Nursery School
Demographics Similar to Puget Sound Salish by Nursery School
In terms of nursery school, the demographic groups most similar to Puget Sound Salish are Romanian (98.3%, a difference of 0.0%), Choctaw (98.3%, a difference of 0.010%), Colville (98.3%, a difference of 0.010%), Immigrants from Ireland (98.3%, a difference of 0.010%), and Cree (98.3%, a difference of 0.010%).
| Demographics | Rating | Rank | Nursery School |
| Immigrants | India | 98.7 /100 | #93 | Exceptional 98.3% |
| Immigrants | Germany | 98.6 /100 | #94 | Exceptional 98.3% |
| South Africans | 98.6 /100 | #95 | Exceptional 98.3% |
| Cypriots | 98.3 /100 | #96 | Exceptional 98.3% |
| Immigrants | Nonimmigrants | 98.3 /100 | #97 | Exceptional 98.3% |
| Choctaw | 98.3 /100 | #98 | Exceptional 98.3% |
| Colville | 98.2 /100 | #99 | Exceptional 98.3% |
| Puget Sound Salish | 98.0 /100 | #100 | Exceptional 98.3% |
| Romanians | 97.9 /100 | #101 | Exceptional 98.3% |
| Immigrants | Ireland | 97.7 /100 | #102 | Exceptional 98.3% |
| Cree | 97.7 /100 | #103 | Exceptional 98.3% |
| Bhutanese | 97.4 /100 | #104 | Exceptional 98.2% |
| Turks | 97.4 /100 | #105 | Exceptional 98.2% |
| Immigrants | Switzerland | 97.3 /100 | #106 | Exceptional 98.2% |
| Basques | 97.3 /100 | #107 | Exceptional 98.2% |
Demographics Similar to Immigrants from Mexico by Nursery School
In terms of nursery school, the demographic groups most similar to Immigrants from Mexico are Immigrants from Cabo Verde (96.4%, a difference of 0.010%), Immigrants from Central America (96.4%, a difference of 0.030%), Salvadoran (96.4%, a difference of 0.030%), Immigrants from Guatemala (96.4%, a difference of 0.060%), and Immigrants from Cambodia (96.5%, a difference of 0.14%).
| Demographics | Rating | Rank | Nursery School |
| Central Americans | 0.0 /100 | #333 | Tragic 96.6% |
| Immigrants | Dominican Republic | 0.0 /100 | #334 | Tragic 96.6% |
| Bangladeshis | 0.0 /100 | #335 | Tragic 96.6% |
| Guatemalans | 0.0 /100 | #336 | Tragic 96.6% |
| Immigrants | Cambodia | 0.0 /100 | #337 | Tragic 96.5% |
| Immigrants | Fiji | 0.0 /100 | #338 | Tragic 96.5% |
| Immigrants | Guatemala | 0.0 /100 | #339 | Tragic 96.4% |
| Immigrants | Central America | 0.0 /100 | #340 | Tragic 96.4% |
| Immigrants | Cabo Verde | 0.0 /100 | #341 | Tragic 96.4% |
| Immigrants | Mexico | 0.0 /100 | #342 | Tragic 96.4% |
| Salvadorans | 0.0 /100 | #343 | Tragic 96.4% |
| Immigrants | El Salvador | 0.0 /100 | #344 | Tragic 96.2% |
| Nepalese | 0.0 /100 | #345 | Tragic 96.2% |
| Immigrants | Yemen | 0.0 /100 | #346 | Tragic 95.9% |
| Spanish American Indians | 0.0 /100 | #347 | Tragic 95.8% |