Puget Sound Salish vs Portuguese Bachelor's Degree
COMPARE
Puget Sound Salish
Portuguese
Bachelor's Degree
Bachelor's Degree Comparison
Puget Sound Salish
Portuguese
30.7%
BACHELOR'S DEGREE
0.0/ 100
METRIC RATING
296th/ 347
METRIC RANK
35.5%
BACHELOR'S DEGREE
7.2/ 100
METRIC RATING
226th/ 347
METRIC RANK
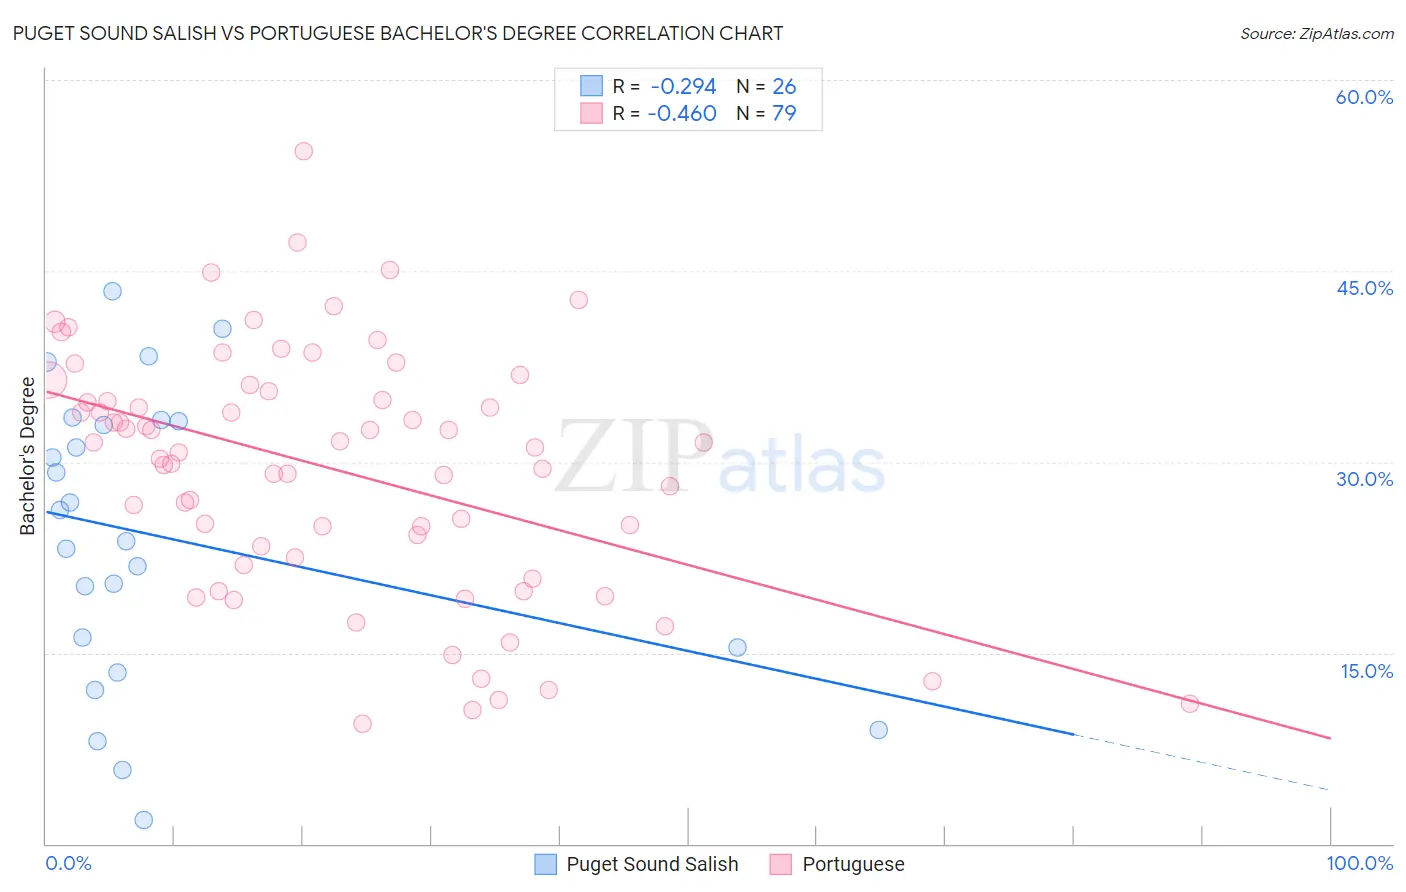
Puget Sound Salish vs Portuguese Bachelor's Degree Correlation Chart
The statistical analysis conducted on geographies consisting of 46,155,865 people shows a weak negative correlation between the proportion of Puget Sound Salish and percentage of population with at least bachelor's degree education in the United States with a correlation coefficient (R) of -0.294 and weighted average of 30.7%. Similarly, the statistical analysis conducted on geographies consisting of 450,314,752 people shows a moderate negative correlation between the proportion of Portuguese and percentage of population with at least bachelor's degree education in the United States with a correlation coefficient (R) of -0.460 and weighted average of 35.5%, a difference of 15.7%.
Bachelor's Degree Correlation Summary
| Measurement | Puget Sound Salish | Portuguese |
| Minimum | 1.9% | 9.4% |
| Maximum | 43.4% | 54.4% |
| Range | 41.6% | 45.0% |
| Mean | 24.1% | 29.4% |
| Median | 25.0% | 31.1% |
| Interquartile 25% (IQ1) | 15.4% | 22.5% |
| Interquartile 75% (IQ3) | 33.2% | 35.6% |
| Interquartile Range (IQR) | 17.8% | 13.1% |
| Standard Deviation (Sample) | 11.4% | 9.6% |
| Standard Deviation (Population) | 11.2% | 9.5% |
Similar Demographics by Bachelor's Degree
Demographics Similar to Puget Sound Salish by Bachelor's Degree
In terms of bachelor's degree, the demographic groups most similar to Puget Sound Salish are Immigrants from Haiti (30.6%, a difference of 0.060%), Immigrants from Dominican Republic (30.7%, a difference of 0.10%), Chippewa (30.6%, a difference of 0.31%), Immigrants from Guatemala (30.8%, a difference of 0.34%), and Cape Verdean (30.9%, a difference of 0.74%).
| Demographics | Rating | Rank | Bachelor's Degree |
| Puerto Ricans | 0.1 /100 | #289 | Tragic 31.0% |
| Immigrants | Honduras | 0.1 /100 | #290 | Tragic 30.9% |
| Blacks/African Americans | 0.1 /100 | #291 | Tragic 30.9% |
| Ute | 0.1 /100 | #292 | Tragic 30.9% |
| Cape Verdeans | 0.1 /100 | #293 | Tragic 30.9% |
| Immigrants | Guatemala | 0.0 /100 | #294 | Tragic 30.8% |
| Immigrants | Dominican Republic | 0.0 /100 | #295 | Tragic 30.7% |
| Puget Sound Salish | 0.0 /100 | #296 | Tragic 30.7% |
| Immigrants | Haiti | 0.0 /100 | #297 | Tragic 30.6% |
| Chippewa | 0.0 /100 | #298 | Tragic 30.6% |
| Chickasaw | 0.0 /100 | #299 | Tragic 30.4% |
| Immigrants | Micronesia | 0.0 /100 | #300 | Tragic 30.4% |
| Immigrants | Cuba | 0.0 /100 | #301 | Tragic 30.3% |
| Mexican American Indians | 0.0 /100 | #302 | Tragic 30.2% |
| Bangladeshis | 0.0 /100 | #303 | Tragic 30.2% |
Demographics Similar to Portuguese by Bachelor's Degree
In terms of bachelor's degree, the demographic groups most similar to Portuguese are Immigrants from Burma/Myanmar (35.5%, a difference of 0.040%), Immigrants from Barbados (35.5%, a difference of 0.11%), Ecuadorian (35.4%, a difference of 0.26%), French Canadian (35.6%, a difference of 0.38%), and Immigrants from Trinidad and Tobago (35.3%, a difference of 0.49%).
| Demographics | Rating | Rank | Bachelor's Degree |
| West Indians | 9.7 /100 | #219 | Tragic 35.8% |
| Spanish | 9.6 /100 | #220 | Tragic 35.8% |
| Dutch | 9.2 /100 | #221 | Tragic 35.7% |
| Trinidadians and Tobagonians | 8.8 /100 | #222 | Tragic 35.7% |
| French Canadians | 8.3 /100 | #223 | Tragic 35.6% |
| Immigrants | Barbados | 7.5 /100 | #224 | Tragic 35.5% |
| Immigrants | Burma/Myanmar | 7.3 /100 | #225 | Tragic 35.5% |
| Portuguese | 7.2 /100 | #226 | Tragic 35.5% |
| Ecuadorians | 6.6 /100 | #227 | Tragic 35.4% |
| Immigrants | Trinidad and Tobago | 6.0 /100 | #228 | Tragic 35.3% |
| Whites/Caucasians | 5.9 /100 | #229 | Tragic 35.3% |
| Immigrants | Grenada | 4.3 /100 | #230 | Tragic 35.0% |
| Immigrants | St. Vincent and the Grenadines | 4.3 /100 | #231 | Tragic 35.0% |
| Hmong | 3.4 /100 | #232 | Tragic 34.8% |
| Immigrants | Ecuador | 3.3 /100 | #233 | Tragic 34.7% |