Pueblo vs Immigrants from Lithuania 9th Grade
COMPARE
Pueblo
Immigrants from Lithuania
9th Grade
9th Grade Comparison
Pueblo
Immigrants from Lithuania
95.1%
9TH GRADE
82.2/ 100
METRIC RATING
145th/ 347
METRIC RANK
95.8%
9TH GRADE
99.6/ 100
METRIC RATING
69th/ 347
METRIC RANK
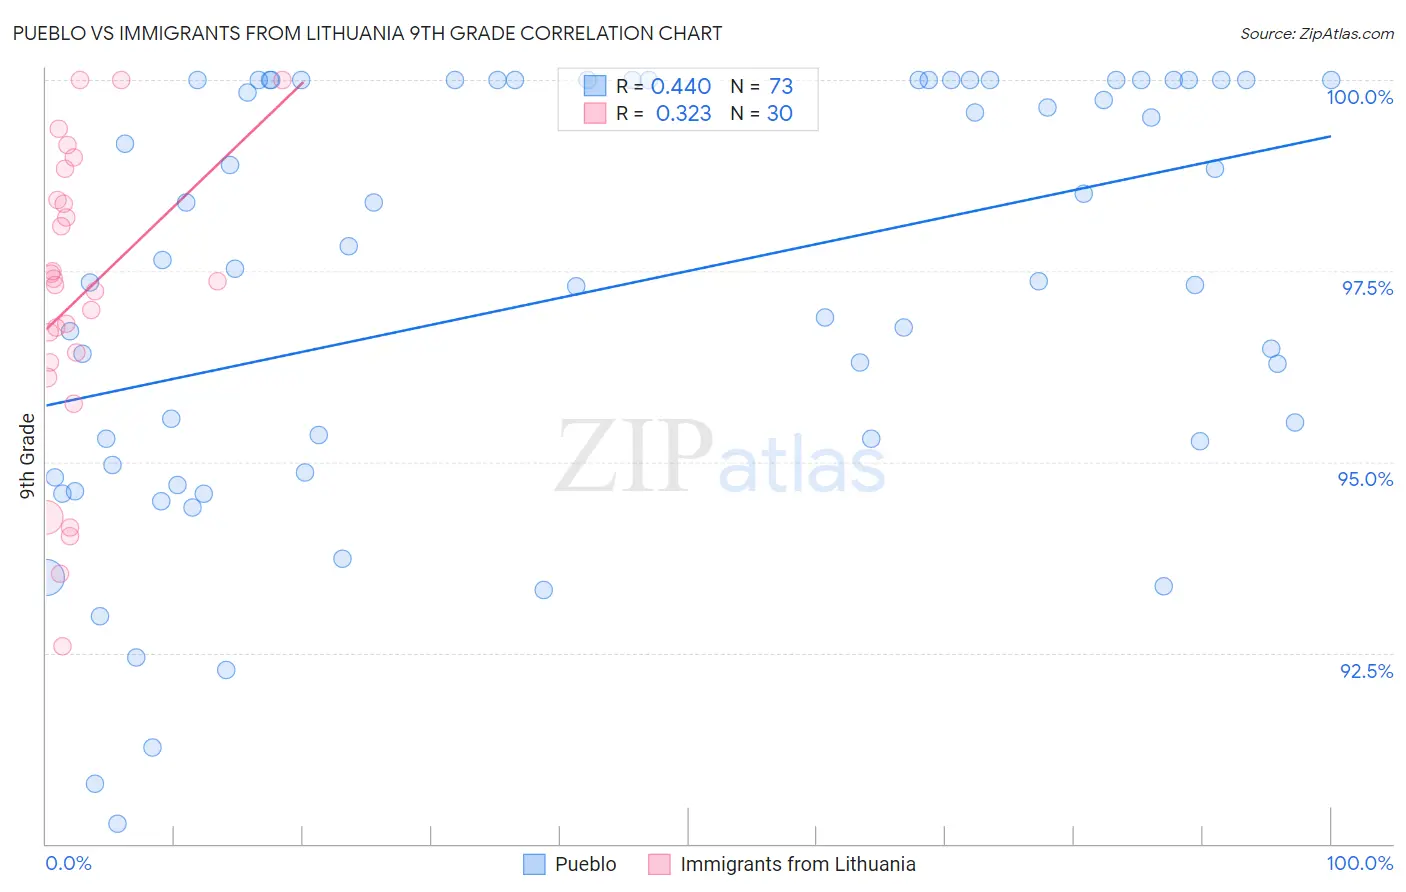
Pueblo vs Immigrants from Lithuania 9th Grade Correlation Chart
The statistical analysis conducted on geographies consisting of 120,086,078 people shows a moderate positive correlation between the proportion of Pueblo and percentage of population with at least 9th grade education in the United States with a correlation coefficient (R) of 0.440 and weighted average of 95.1%. Similarly, the statistical analysis conducted on geographies consisting of 117,724,932 people shows a mild positive correlation between the proportion of Immigrants from Lithuania and percentage of population with at least 9th grade education in the United States with a correlation coefficient (R) of 0.323 and weighted average of 95.8%, a difference of 0.72%.
9th Grade Correlation Summary
| Measurement | Pueblo | Immigrants from Lithuania |
| Minimum | 90.3% | 92.6% |
| Maximum | 100.0% | 100.0% |
| Range | 9.7% | 7.4% |
| Mean | 97.2% | 97.1% |
| Median | 97.5% | 97.3% |
| Interquartile 25% (IQ1) | 94.9% | 96.3% |
| Interquartile 75% (IQ3) | 100.0% | 98.4% |
| Interquartile Range (IQR) | 5.1% | 2.1% |
| Standard Deviation (Sample) | 2.8% | 2.0% |
| Standard Deviation (Population) | 2.7% | 1.9% |
Similar Demographics by 9th Grade
Demographics Similar to Pueblo by 9th Grade
In terms of 9th grade, the demographic groups most similar to Pueblo are Immigrants from Sri Lanka (95.1%, a difference of 0.0%), Choctaw (95.1%, a difference of 0.0%), Immigrants from Jordan (95.1%, a difference of 0.010%), Yup'ik (95.2%, a difference of 0.020%), and Immigrants from Greece (95.2%, a difference of 0.030%).
| Demographics | Rating | Rank | 9th Grade |
| Immigrants | Russia | 86.6 /100 | #138 | Excellent 95.2% |
| Immigrants | Eastern Europe | 85.8 /100 | #139 | Excellent 95.2% |
| Immigrants | Taiwan | 85.3 /100 | #140 | Excellent 95.2% |
| Immigrants | Bosnia and Herzegovina | 85.2 /100 | #141 | Excellent 95.2% |
| Immigrants | Greece | 84.6 /100 | #142 | Excellent 95.2% |
| Spanish | 84.4 /100 | #143 | Excellent 95.2% |
| Yup'ik | 83.3 /100 | #144 | Excellent 95.2% |
| Pueblo | 82.2 /100 | #145 | Excellent 95.1% |
| Immigrants | Sri Lanka | 82.1 /100 | #146 | Excellent 95.1% |
| Choctaw | 81.9 /100 | #147 | Excellent 95.1% |
| Immigrants | Jordan | 81.2 /100 | #148 | Excellent 95.1% |
| Immigrants | Korea | 79.6 /100 | #149 | Good 95.1% |
| Kenyans | 79.1 /100 | #150 | Good 95.1% |
| Cajuns | 77.3 /100 | #151 | Good 95.1% |
| Ugandans | 77.0 /100 | #152 | Good 95.1% |
Demographics Similar to Immigrants from Lithuania by 9th Grade
In terms of 9th grade, the demographic groups most similar to Immigrants from Lithuania are Cypriot (95.8%, a difference of 0.0%), Immigrants from Ireland (95.8%, a difference of 0.0%), Immigrants from Netherlands (95.8%, a difference of 0.010%), Immigrants from Australia (95.8%, a difference of 0.020%), and Immigrants from Belgium (95.8%, a difference of 0.020%).
| Demographics | Rating | Rank | 9th Grade |
| Ukrainians | 99.7 /100 | #62 | Exceptional 95.9% |
| Canadians | 99.7 /100 | #63 | Exceptional 95.9% |
| Zimbabweans | 99.7 /100 | #64 | Exceptional 95.9% |
| Immigrants | England | 99.6 /100 | #65 | Exceptional 95.9% |
| Immigrants | Netherlands | 99.6 /100 | #66 | Exceptional 95.8% |
| Cypriots | 99.6 /100 | #67 | Exceptional 95.8% |
| Immigrants | Ireland | 99.6 /100 | #68 | Exceptional 95.8% |
| Immigrants | Lithuania | 99.6 /100 | #69 | Exceptional 95.8% |
| Immigrants | Australia | 99.5 /100 | #70 | Exceptional 95.8% |
| Immigrants | Belgium | 99.5 /100 | #71 | Exceptional 95.8% |
| Turks | 99.5 /100 | #72 | Exceptional 95.8% |
| Immigrants | Singapore | 99.5 /100 | #73 | Exceptional 95.8% |
| Thais | 99.5 /100 | #74 | Exceptional 95.8% |
| Inupiat | 99.5 /100 | #75 | Exceptional 95.8% |
| Immigrants | Sweden | 99.5 /100 | #76 | Exceptional 95.8% |