Pueblo vs Immigrants from Fiji 10th Grade
COMPARE
Pueblo
Immigrants from Fiji
10th Grade
10th Grade Comparison
Pueblo
Immigrants from Fiji
93.5%
10TH GRADE
23.9/ 100
METRIC RATING
197th/ 347
METRIC RANK
91.0%
10TH GRADE
0.0/ 100
METRIC RATING
307th/ 347
METRIC RANK
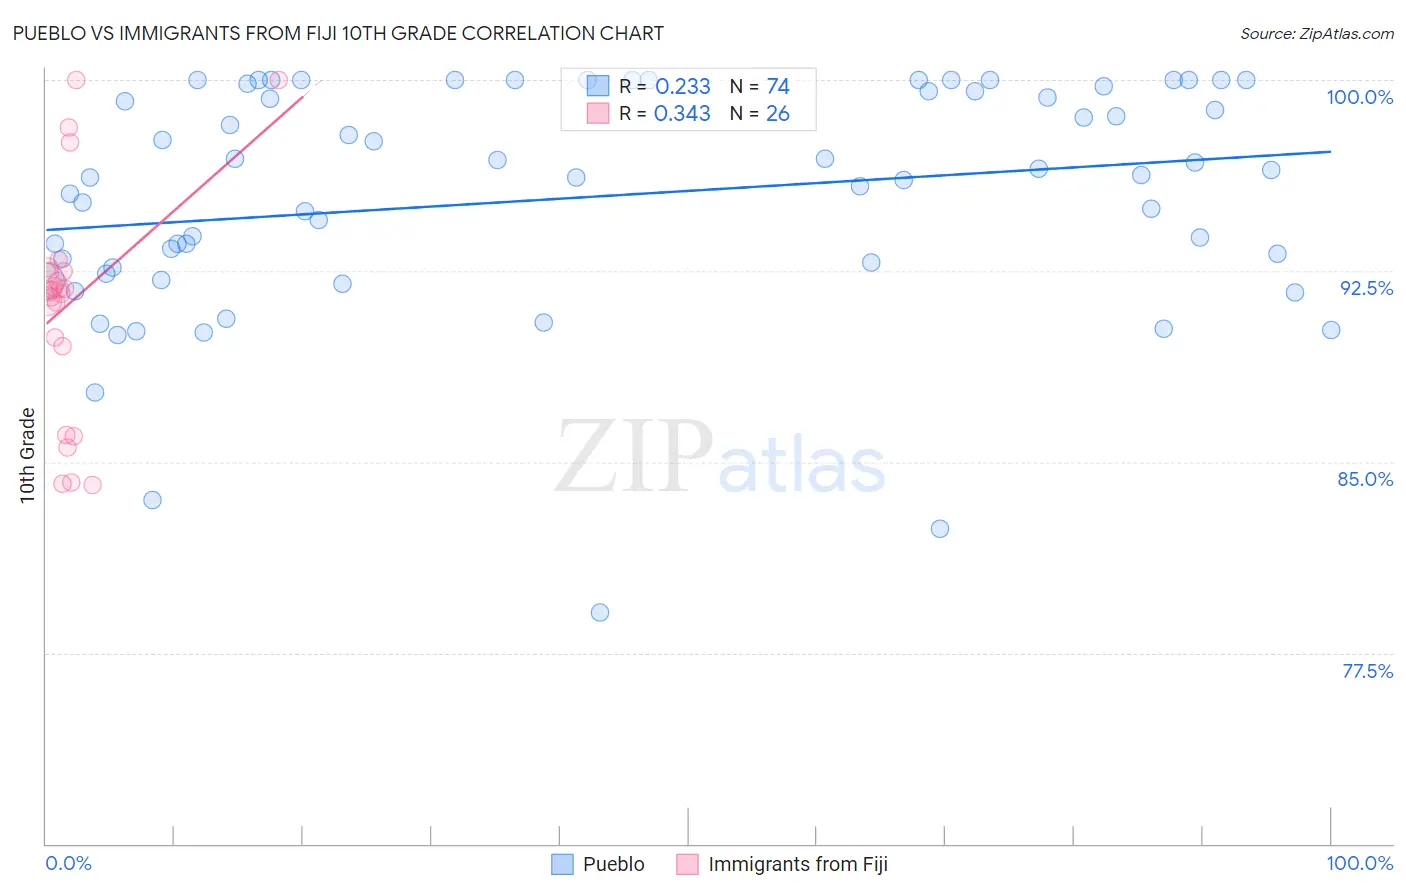
Pueblo vs Immigrants from Fiji 10th Grade Correlation Chart
The statistical analysis conducted on geographies consisting of 120,087,458 people shows a weak positive correlation between the proportion of Pueblo and percentage of population with at least 10th grade education in the United States with a correlation coefficient (R) of 0.233 and weighted average of 93.5%. Similarly, the statistical analysis conducted on geographies consisting of 93,756,204 people shows a mild positive correlation between the proportion of Immigrants from Fiji and percentage of population with at least 10th grade education in the United States with a correlation coefficient (R) of 0.343 and weighted average of 91.0%, a difference of 2.7%.
10th Grade Correlation Summary
| Measurement | Pueblo | Immigrants from Fiji |
| Minimum | 79.1% | 84.1% |
| Maximum | 100.0% | 100.0% |
| Range | 20.9% | 15.9% |
| Mean | 95.4% | 91.2% |
| Median | 96.2% | 91.7% |
| Interquartile 25% (IQ1) | 92.6% | 89.5% |
| Interquartile 75% (IQ3) | 99.6% | 92.5% |
| Interquartile Range (IQR) | 7.0% | 2.9% |
| Standard Deviation (Sample) | 4.5% | 4.4% |
| Standard Deviation (Population) | 4.5% | 4.4% |
Similar Demographics by 10th Grade
Demographics Similar to Pueblo by 10th Grade
In terms of 10th grade, the demographic groups most similar to Pueblo are Immigrants from Micronesia (93.5%, a difference of 0.010%), Asian (93.5%, a difference of 0.010%), Moroccan (93.5%, a difference of 0.020%), Hopi (93.5%, a difference of 0.020%), and Cheyenne (93.5%, a difference of 0.030%).
| Demographics | Rating | Rank | 10th Grade |
| Laotians | 32.1 /100 | #190 | Fair 93.6% |
| Yup'ik | 31.1 /100 | #191 | Fair 93.6% |
| Immigrants | Malaysia | 28.0 /100 | #192 | Fair 93.5% |
| Panamanians | 28.0 /100 | #193 | Fair 93.5% |
| Immigrants | Morocco | 26.9 /100 | #194 | Fair 93.5% |
| Cheyenne | 26.8 /100 | #195 | Fair 93.5% |
| Moroccans | 25.3 /100 | #196 | Fair 93.5% |
| Pueblo | 23.9 /100 | #197 | Fair 93.5% |
| Immigrants | Micronesia | 23.2 /100 | #198 | Fair 93.5% |
| Asians | 23.0 /100 | #199 | Fair 93.5% |
| Hopi | 22.2 /100 | #200 | Fair 93.5% |
| Hawaiians | 21.8 /100 | #201 | Fair 93.5% |
| Immigrants | Uganda | 20.9 /100 | #202 | Fair 93.5% |
| Immigrants | Western Asia | 20.6 /100 | #203 | Fair 93.4% |
| Ute | 20.3 /100 | #204 | Fair 93.4% |
Demographics Similar to Immigrants from Fiji by 10th Grade
In terms of 10th grade, the demographic groups most similar to Immigrants from Fiji are Immigrants from Bangladesh (91.0%, a difference of 0.010%), Immigrants (91.0%, a difference of 0.050%), Yaqui (91.1%, a difference of 0.060%), Vietnamese (90.9%, a difference of 0.090%), and Immigrants from Cambodia (90.9%, a difference of 0.11%).
| Demographics | Rating | Rank | 10th Grade |
| Guyanese | 0.0 /100 | #300 | Tragic 91.4% |
| Japanese | 0.0 /100 | #301 | Tragic 91.2% |
| Immigrants | Guyana | 0.0 /100 | #302 | Tragic 91.2% |
| Immigrants | Vietnam | 0.0 /100 | #303 | Tragic 91.2% |
| Pima | 0.0 /100 | #304 | Tragic 91.2% |
| Immigrants | Dominica | 0.0 /100 | #305 | Tragic 91.1% |
| Yaqui | 0.0 /100 | #306 | Tragic 91.1% |
| Immigrants | Fiji | 0.0 /100 | #307 | Tragic 91.0% |
| Immigrants | Bangladesh | 0.0 /100 | #308 | Tragic 91.0% |
| Immigrants | Immigrants | 0.0 /100 | #309 | Tragic 91.0% |
| Vietnamese | 0.0 /100 | #310 | Tragic 90.9% |
| Immigrants | Cambodia | 0.0 /100 | #311 | Tragic 90.9% |
| Immigrants | Portugal | 0.0 /100 | #312 | Tragic 90.8% |
| Cape Verdeans | 0.0 /100 | #313 | Tragic 90.8% |
| Nepalese | 0.0 /100 | #314 | Tragic 90.7% |