Pueblo vs Latvian 10th Grade
COMPARE
Pueblo
Latvian
10th Grade
10th Grade Comparison
Pueblo
Latvians
93.5%
10TH GRADE
23.9/ 100
METRIC RATING
197th/ 347
METRIC RANK
95.6%
10TH GRADE
100.0/ 100
METRIC RATING
17th/ 347
METRIC RANK
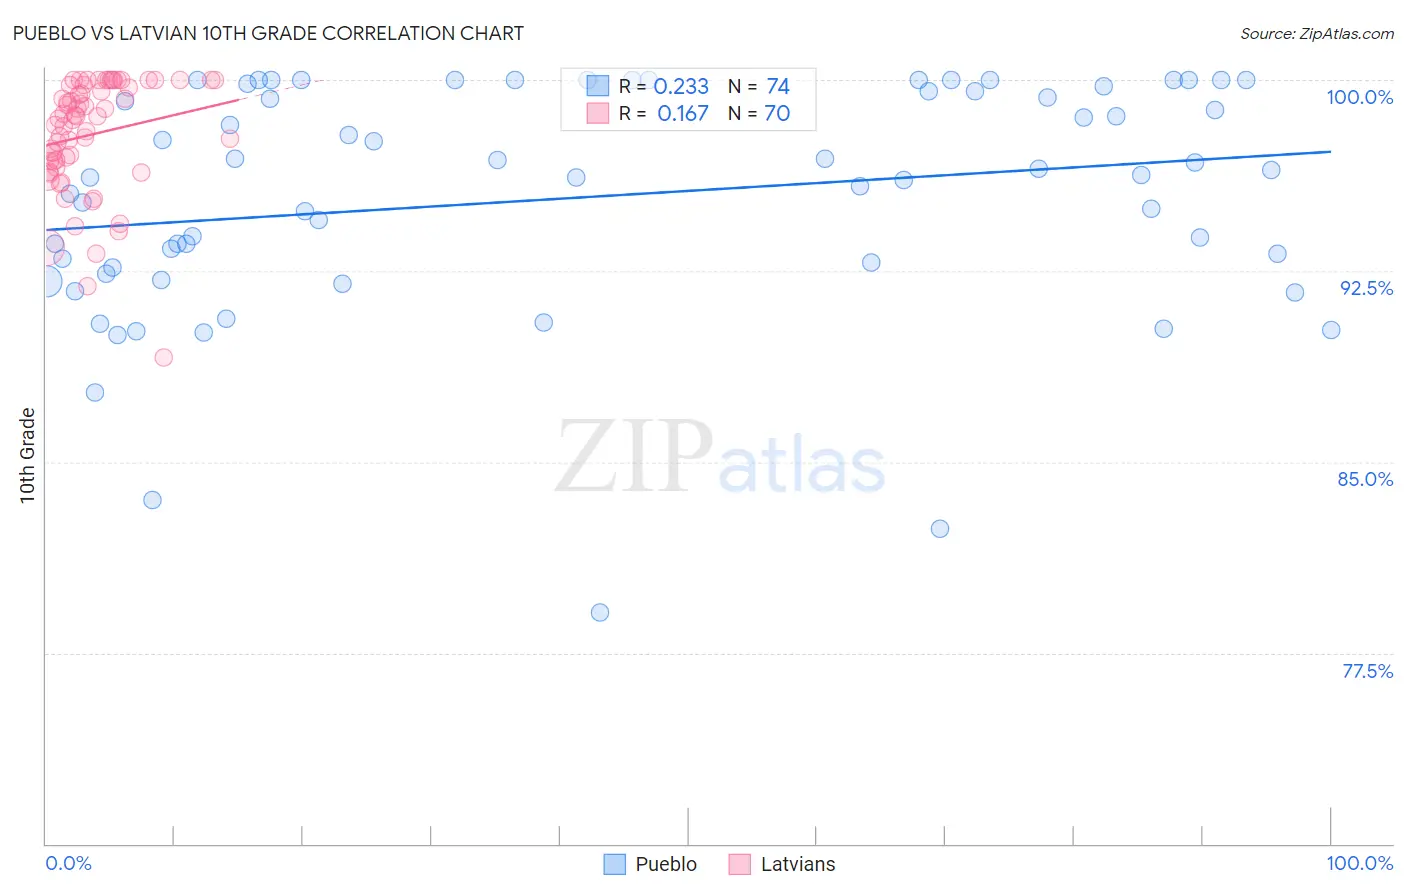
Pueblo vs Latvian 10th Grade Correlation Chart
The statistical analysis conducted on geographies consisting of 120,087,458 people shows a weak positive correlation between the proportion of Pueblo and percentage of population with at least 10th grade education in the United States with a correlation coefficient (R) of 0.233 and weighted average of 93.5%. Similarly, the statistical analysis conducted on geographies consisting of 220,726,693 people shows a poor positive correlation between the proportion of Latvians and percentage of population with at least 10th grade education in the United States with a correlation coefficient (R) of 0.167 and weighted average of 95.6%, a difference of 2.2%.
10th Grade Correlation Summary
| Measurement | Pueblo | Latvian |
| Minimum | 79.1% | 89.1% |
| Maximum | 100.0% | 100.0% |
| Range | 20.9% | 10.9% |
| Mean | 95.4% | 97.8% |
| Median | 96.2% | 98.5% |
| Interquartile 25% (IQ1) | 92.6% | 96.8% |
| Interquartile 75% (IQ3) | 99.6% | 99.8% |
| Interquartile Range (IQR) | 7.0% | 3.0% |
| Standard Deviation (Sample) | 4.5% | 2.2% |
| Standard Deviation (Population) | 4.5% | 2.2% |
Similar Demographics by 10th Grade
Demographics Similar to Pueblo by 10th Grade
In terms of 10th grade, the demographic groups most similar to Pueblo are Immigrants from Micronesia (93.5%, a difference of 0.010%), Asian (93.5%, a difference of 0.010%), Moroccan (93.5%, a difference of 0.020%), Hopi (93.5%, a difference of 0.020%), and Cheyenne (93.5%, a difference of 0.030%).
| Demographics | Rating | Rank | 10th Grade |
| Laotians | 32.1 /100 | #190 | Fair 93.6% |
| Yup'ik | 31.1 /100 | #191 | Fair 93.6% |
| Immigrants | Malaysia | 28.0 /100 | #192 | Fair 93.5% |
| Panamanians | 28.0 /100 | #193 | Fair 93.5% |
| Immigrants | Morocco | 26.9 /100 | #194 | Fair 93.5% |
| Cheyenne | 26.8 /100 | #195 | Fair 93.5% |
| Moroccans | 25.3 /100 | #196 | Fair 93.5% |
| Pueblo | 23.9 /100 | #197 | Fair 93.5% |
| Immigrants | Micronesia | 23.2 /100 | #198 | Fair 93.5% |
| Asians | 23.0 /100 | #199 | Fair 93.5% |
| Hopi | 22.2 /100 | #200 | Fair 93.5% |
| Hawaiians | 21.8 /100 | #201 | Fair 93.5% |
| Immigrants | Uganda | 20.9 /100 | #202 | Fair 93.5% |
| Immigrants | Western Asia | 20.6 /100 | #203 | Fair 93.4% |
| Ute | 20.3 /100 | #204 | Fair 93.4% |
Demographics Similar to Latvians by 10th Grade
In terms of 10th grade, the demographic groups most similar to Latvians are Scottish (95.6%, a difference of 0.010%), Italian (95.6%, a difference of 0.010%), Scandinavian (95.6%, a difference of 0.010%), Irish (95.6%, a difference of 0.020%), and Chinese (95.5%, a difference of 0.030%).
| Demographics | Rating | Rank | 10th Grade |
| Croatians | 100.0 /100 | #10 | Exceptional 95.7% |
| Danes | 100.0 /100 | #11 | Exceptional 95.7% |
| Tlingit-Haida | 100.0 /100 | #12 | Exceptional 95.7% |
| English | 100.0 /100 | #13 | Exceptional 95.6% |
| Tsimshian | 100.0 /100 | #14 | Exceptional 95.6% |
| Irish | 100.0 /100 | #15 | Exceptional 95.6% |
| Scottish | 100.0 /100 | #16 | Exceptional 95.6% |
| Latvians | 100.0 /100 | #17 | Exceptional 95.6% |
| Italians | 100.0 /100 | #18 | Exceptional 95.6% |
| Scandinavians | 100.0 /100 | #19 | Exceptional 95.6% |
| Chinese | 100.0 /100 | #20 | Exceptional 95.5% |
| Dutch | 100.0 /100 | #21 | Exceptional 95.5% |
| Eastern Europeans | 100.0 /100 | #22 | Exceptional 95.5% |
| Czechs | 100.0 /100 | #23 | Exceptional 95.5% |
| Europeans | 100.0 /100 | #24 | Exceptional 95.5% |