Potawatomi vs Nigerian Bachelor's Degree
COMPARE
Potawatomi
Nigerian
Bachelor's Degree
Bachelor's Degree Comparison
Potawatomi
Nigerians
31.9%
BACHELOR'S DEGREE
0.2/ 100
METRIC RATING
274th/ 347
METRIC RANK
37.2%
BACHELOR'S DEGREE
33.9/ 100
METRIC RATING
191st/ 347
METRIC RANK
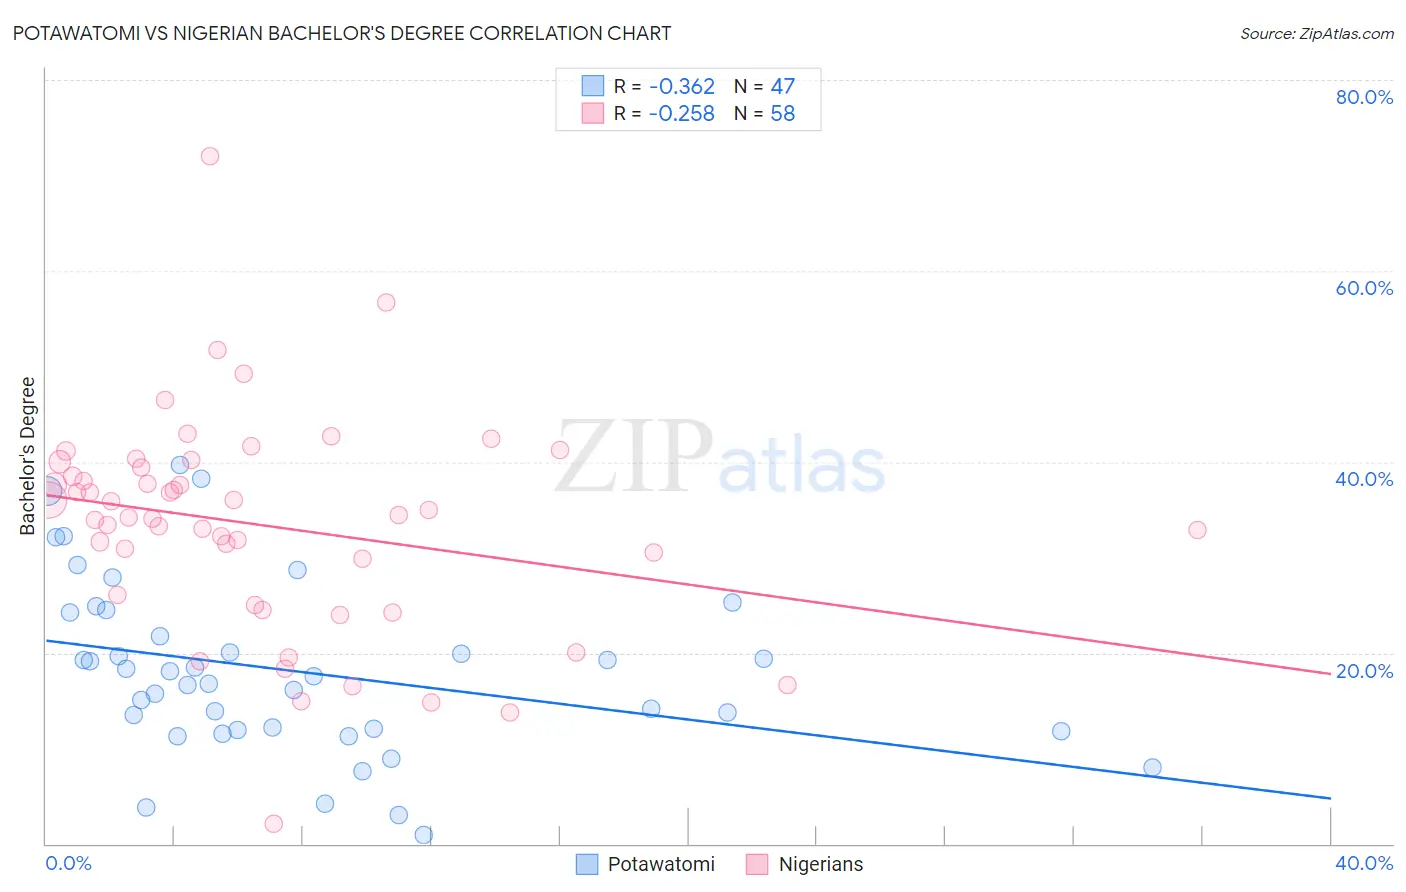
Potawatomi vs Nigerian Bachelor's Degree Correlation Chart
The statistical analysis conducted on geographies consisting of 117,773,137 people shows a mild negative correlation between the proportion of Potawatomi and percentage of population with at least bachelor's degree education in the United States with a correlation coefficient (R) of -0.362 and weighted average of 31.9%. Similarly, the statistical analysis conducted on geographies consisting of 332,744,449 people shows a weak negative correlation between the proportion of Nigerians and percentage of population with at least bachelor's degree education in the United States with a correlation coefficient (R) of -0.258 and weighted average of 37.2%, a difference of 16.8%.
Bachelor's Degree Correlation Summary
| Measurement | Potawatomi | Nigerian |
| Minimum | 0.98% | 2.0% |
| Maximum | 39.6% | 72.0% |
| Range | 38.6% | 70.0% |
| Mean | 18.0% | 33.4% |
| Median | 17.5% | 34.3% |
| Interquartile 25% (IQ1) | 11.9% | 26.1% |
| Interquartile 75% (IQ3) | 24.2% | 39.4% |
| Interquartile Range (IQR) | 12.3% | 13.3% |
| Standard Deviation (Sample) | 9.0% | 11.4% |
| Standard Deviation (Population) | 8.9% | 11.3% |
Similar Demographics by Bachelor's Degree
Demographics Similar to Potawatomi by Bachelor's Degree
In terms of bachelor's degree, the demographic groups most similar to Potawatomi are American (31.9%, a difference of 0.020%), Samoan (31.8%, a difference of 0.13%), Comanche (31.9%, a difference of 0.14%), Central American (31.9%, a difference of 0.17%), and Salvadoran (31.8%, a difference of 0.17%).
| Demographics | Rating | Rank | Bachelor's Degree |
| Cubans | 0.3 /100 | #267 | Tragic 32.5% |
| Immigrants | Portugal | 0.2 /100 | #268 | Tragic 32.2% |
| Immigrants | Belize | 0.2 /100 | #269 | Tragic 32.1% |
| Immigrants | Nicaragua | 0.2 /100 | #270 | Tragic 31.9% |
| Central Americans | 0.2 /100 | #271 | Tragic 31.9% |
| Comanche | 0.2 /100 | #272 | Tragic 31.9% |
| Americans | 0.2 /100 | #273 | Tragic 31.9% |
| Potawatomi | 0.2 /100 | #274 | Tragic 31.9% |
| Samoans | 0.1 /100 | #275 | Tragic 31.8% |
| Salvadorans | 0.1 /100 | #276 | Tragic 31.8% |
| Dominicans | 0.1 /100 | #277 | Tragic 31.8% |
| Marshallese | 0.1 /100 | #278 | Tragic 31.7% |
| Hawaiians | 0.1 /100 | #279 | Tragic 31.6% |
| Immigrants | Laos | 0.1 /100 | #280 | Tragic 31.6% |
| Blackfeet | 0.1 /100 | #281 | Tragic 31.5% |
Demographics Similar to Nigerians by Bachelor's Degree
In terms of bachelor's degree, the demographic groups most similar to Nigerians are Swiss (37.2%, a difference of 0.020%), Immigrants from Vietnam (37.1%, a difference of 0.20%), Yugoslavian (37.1%, a difference of 0.27%), Slovak (37.3%, a difference of 0.32%), and Immigrants from Oceania (37.3%, a difference of 0.37%).
| Demographics | Rating | Rank | Bachelor's Degree |
| Scandinavians | 41.7 /100 | #184 | Average 37.5% |
| Immigrants | Peru | 41.3 /100 | #185 | Average 37.5% |
| Norwegians | 40.4 /100 | #186 | Average 37.5% |
| English | 39.7 /100 | #187 | Fair 37.4% |
| Immigrants | Oceania | 37.3 /100 | #188 | Fair 37.3% |
| Slovaks | 36.9 /100 | #189 | Fair 37.3% |
| Swiss | 34.1 /100 | #190 | Fair 37.2% |
| Nigerians | 33.9 /100 | #191 | Fair 37.2% |
| Immigrants | Vietnam | 32.1 /100 | #192 | Fair 37.1% |
| Yugoslavians | 31.5 /100 | #193 | Fair 37.1% |
| Belgians | 29.9 /100 | #194 | Fair 37.0% |
| Koreans | 29.8 /100 | #195 | Fair 37.0% |
| Celtics | 29.5 /100 | #196 | Fair 37.0% |
| Czechoslovakians | 29.2 /100 | #197 | Fair 37.0% |
| Welsh | 29.1 /100 | #198 | Fair 37.0% |