Potawatomi vs Immigrants from Egypt Bachelor's Degree
COMPARE
Potawatomi
Immigrants from Egypt
Bachelor's Degree
Bachelor's Degree Comparison
Potawatomi
Immigrants from Egypt
31.9%
BACHELOR'S DEGREE
0.2/ 100
METRIC RATING
274th/ 347
METRIC RANK
42.6%
BACHELOR'S DEGREE
99.4/ 100
METRIC RATING
76th/ 347
METRIC RANK
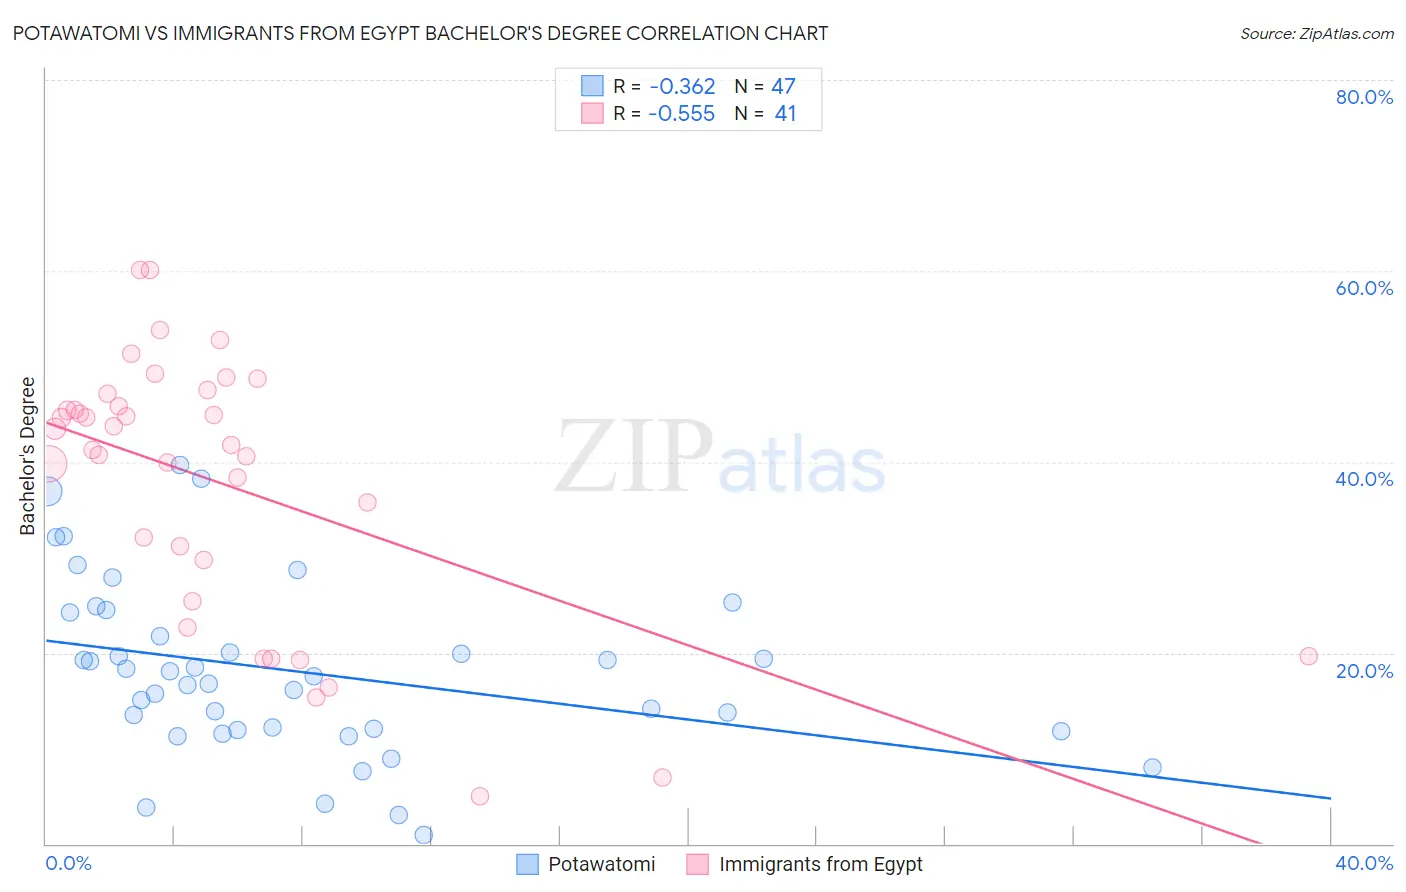
Potawatomi vs Immigrants from Egypt Bachelor's Degree Correlation Chart
The statistical analysis conducted on geographies consisting of 117,773,137 people shows a mild negative correlation between the proportion of Potawatomi and percentage of population with at least bachelor's degree education in the United States with a correlation coefficient (R) of -0.362 and weighted average of 31.9%. Similarly, the statistical analysis conducted on geographies consisting of 245,484,715 people shows a substantial negative correlation between the proportion of Immigrants from Egypt and percentage of population with at least bachelor's degree education in the United States with a correlation coefficient (R) of -0.555 and weighted average of 42.6%, a difference of 33.6%.
Bachelor's Degree Correlation Summary
| Measurement | Potawatomi | Immigrants from Egypt |
| Minimum | 0.98% | 5.0% |
| Maximum | 39.6% | 60.1% |
| Range | 38.6% | 55.1% |
| Mean | 18.0% | 37.8% |
| Median | 17.5% | 41.8% |
| Interquartile 25% (IQ1) | 11.9% | 27.6% |
| Interquartile 75% (IQ3) | 24.2% | 46.5% |
| Interquartile Range (IQR) | 12.3% | 19.0% |
| Standard Deviation (Sample) | 9.0% | 13.8% |
| Standard Deviation (Population) | 8.9% | 13.6% |
Similar Demographics by Bachelor's Degree
Demographics Similar to Potawatomi by Bachelor's Degree
In terms of bachelor's degree, the demographic groups most similar to Potawatomi are American (31.9%, a difference of 0.020%), Samoan (31.8%, a difference of 0.13%), Comanche (31.9%, a difference of 0.14%), Central American (31.9%, a difference of 0.17%), and Salvadoran (31.8%, a difference of 0.17%).
| Demographics | Rating | Rank | Bachelor's Degree |
| Cubans | 0.3 /100 | #267 | Tragic 32.5% |
| Immigrants | Portugal | 0.2 /100 | #268 | Tragic 32.2% |
| Immigrants | Belize | 0.2 /100 | #269 | Tragic 32.1% |
| Immigrants | Nicaragua | 0.2 /100 | #270 | Tragic 31.9% |
| Central Americans | 0.2 /100 | #271 | Tragic 31.9% |
| Comanche | 0.2 /100 | #272 | Tragic 31.9% |
| Americans | 0.2 /100 | #273 | Tragic 31.9% |
| Potawatomi | 0.2 /100 | #274 | Tragic 31.9% |
| Samoans | 0.1 /100 | #275 | Tragic 31.8% |
| Salvadorans | 0.1 /100 | #276 | Tragic 31.8% |
| Dominicans | 0.1 /100 | #277 | Tragic 31.8% |
| Marshallese | 0.1 /100 | #278 | Tragic 31.7% |
| Hawaiians | 0.1 /100 | #279 | Tragic 31.6% |
| Immigrants | Laos | 0.1 /100 | #280 | Tragic 31.6% |
| Blackfeet | 0.1 /100 | #281 | Tragic 31.5% |
Demographics Similar to Immigrants from Egypt by Bachelor's Degree
In terms of bachelor's degree, the demographic groups most similar to Immigrants from Egypt are Immigrants from Zimbabwe (42.6%, a difference of 0.020%), Immigrants from Eastern Europe (42.5%, a difference of 0.18%), Bhutanese (42.7%, a difference of 0.23%), Immigrants from Ethiopia (42.5%, a difference of 0.24%), and Immigrants from Lebanon (42.4%, a difference of 0.40%).
| Demographics | Rating | Rank | Bachelor's Degree |
| Immigrants | Pakistan | 99.7 /100 | #69 | Exceptional 43.1% |
| Immigrants | Romania | 99.6 /100 | #70 | Exceptional 42.9% |
| Immigrants | Argentina | 99.6 /100 | #71 | Exceptional 42.8% |
| Ethiopians | 99.5 /100 | #72 | Exceptional 42.8% |
| Immigrants | Uzbekistan | 99.5 /100 | #73 | Exceptional 42.8% |
| Bhutanese | 99.5 /100 | #74 | Exceptional 42.7% |
| Immigrants | Zimbabwe | 99.4 /100 | #75 | Exceptional 42.6% |
| Immigrants | Egypt | 99.4 /100 | #76 | Exceptional 42.6% |
| Immigrants | Eastern Europe | 99.4 /100 | #77 | Exceptional 42.5% |
| Immigrants | Ethiopia | 99.4 /100 | #78 | Exceptional 42.5% |
| Immigrants | Lebanon | 99.3 /100 | #79 | Exceptional 42.4% |
| Immigrants | Croatia | 99.2 /100 | #80 | Exceptional 42.3% |
| Immigrants | Hungary | 99.2 /100 | #81 | Exceptional 42.3% |
| Immigrants | Scotland | 99.2 /100 | #82 | Exceptional 42.3% |
| Armenians | 99.2 /100 | #83 | Exceptional 42.3% |