Potawatomi vs Hispanic or Latino Bachelor's Degree
COMPARE
Potawatomi
Hispanic or Latino
Bachelor's Degree
Bachelor's Degree Comparison
Potawatomi
Hispanics or Latinos
31.9%
BACHELOR'S DEGREE
0.2/ 100
METRIC RATING
274th/ 347
METRIC RANK
29.6%
BACHELOR'S DEGREE
0.0/ 100
METRIC RATING
309th/ 347
METRIC RANK
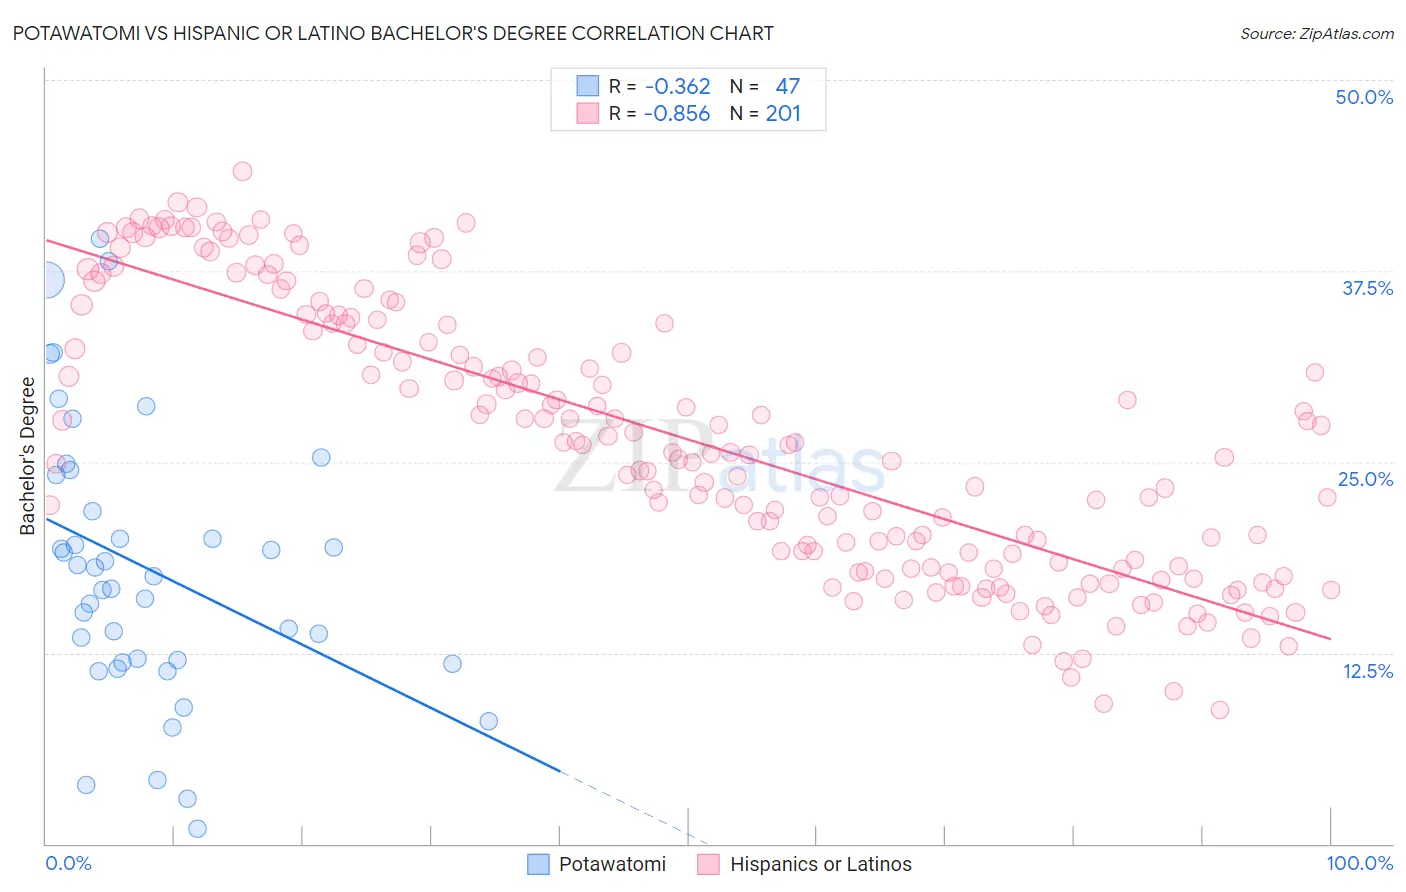
Potawatomi vs Hispanic or Latino Bachelor's Degree Correlation Chart
The statistical analysis conducted on geographies consisting of 117,773,137 people shows a mild negative correlation between the proportion of Potawatomi and percentage of population with at least bachelor's degree education in the United States with a correlation coefficient (R) of -0.362 and weighted average of 31.9%. Similarly, the statistical analysis conducted on geographies consisting of 578,331,176 people shows a very strong negative correlation between the proportion of Hispanics or Latinos and percentage of population with at least bachelor's degree education in the United States with a correlation coefficient (R) of -0.856 and weighted average of 29.6%, a difference of 7.7%.
Bachelor's Degree Correlation Summary
| Measurement | Potawatomi | Hispanic or Latino |
| Minimum | 0.98% | 8.7% |
| Maximum | 39.6% | 44.0% |
| Range | 38.6% | 35.3% |
| Mean | 18.0% | 26.4% |
| Median | 17.5% | 25.6% |
| Interquartile 25% (IQ1) | 11.9% | 18.1% |
| Interquartile 75% (IQ3) | 24.2% | 34.1% |
| Interquartile Range (IQR) | 12.3% | 16.0% |
| Standard Deviation (Sample) | 9.0% | 8.9% |
| Standard Deviation (Population) | 8.9% | 8.9% |
Similar Demographics by Bachelor's Degree
Demographics Similar to Potawatomi by Bachelor's Degree
In terms of bachelor's degree, the demographic groups most similar to Potawatomi are American (31.9%, a difference of 0.020%), Samoan (31.8%, a difference of 0.13%), Comanche (31.9%, a difference of 0.14%), Central American (31.9%, a difference of 0.17%), and Salvadoran (31.8%, a difference of 0.17%).
| Demographics | Rating | Rank | Bachelor's Degree |
| Cubans | 0.3 /100 | #267 | Tragic 32.5% |
| Immigrants | Portugal | 0.2 /100 | #268 | Tragic 32.2% |
| Immigrants | Belize | 0.2 /100 | #269 | Tragic 32.1% |
| Immigrants | Nicaragua | 0.2 /100 | #270 | Tragic 31.9% |
| Central Americans | 0.2 /100 | #271 | Tragic 31.9% |
| Comanche | 0.2 /100 | #272 | Tragic 31.9% |
| Americans | 0.2 /100 | #273 | Tragic 31.9% |
| Potawatomi | 0.2 /100 | #274 | Tragic 31.9% |
| Samoans | 0.1 /100 | #275 | Tragic 31.8% |
| Salvadorans | 0.1 /100 | #276 | Tragic 31.8% |
| Dominicans | 0.1 /100 | #277 | Tragic 31.8% |
| Marshallese | 0.1 /100 | #278 | Tragic 31.7% |
| Hawaiians | 0.1 /100 | #279 | Tragic 31.6% |
| Immigrants | Laos | 0.1 /100 | #280 | Tragic 31.6% |
| Blackfeet | 0.1 /100 | #281 | Tragic 31.5% |
Demographics Similar to Hispanics or Latinos by Bachelor's Degree
In terms of bachelor's degree, the demographic groups most similar to Hispanics or Latinos are Cajun (29.6%, a difference of 0.18%), Cheyenne (29.4%, a difference of 0.47%), Choctaw (29.4%, a difference of 0.54%), Seminole (29.4%, a difference of 0.60%), and Alaska Native (29.4%, a difference of 0.78%).
| Demographics | Rating | Rank | Bachelor's Degree |
| Mexican American Indians | 0.0 /100 | #302 | Tragic 30.2% |
| Bangladeshis | 0.0 /100 | #303 | Tragic 30.2% |
| Cherokee | 0.0 /100 | #304 | Tragic 30.2% |
| Immigrants | Latin America | 0.0 /100 | #305 | Tragic 30.1% |
| Immigrants | Yemen | 0.0 /100 | #306 | Tragic 29.9% |
| Nepalese | 0.0 /100 | #307 | Tragic 29.9% |
| Cajuns | 0.0 /100 | #308 | Tragic 29.6% |
| Hispanics or Latinos | 0.0 /100 | #309 | Tragic 29.6% |
| Cheyenne | 0.0 /100 | #310 | Tragic 29.4% |
| Choctaw | 0.0 /100 | #311 | Tragic 29.4% |
| Seminole | 0.0 /100 | #312 | Tragic 29.4% |
| Alaska Natives | 0.0 /100 | #313 | Tragic 29.4% |
| Shoshone | 0.0 /100 | #314 | Tragic 29.3% |
| Immigrants | Cabo Verde | 0.0 /100 | #315 | Tragic 29.2% |
| Sioux | 0.0 /100 | #316 | Tragic 29.1% |