Potawatomi vs South American Bachelor's Degree
COMPARE
Potawatomi
South American
Bachelor's Degree
Bachelor's Degree Comparison
Potawatomi
South Americans
31.9%
BACHELOR'S DEGREE
0.2/ 100
METRIC RATING
274th/ 347
METRIC RANK
38.9%
BACHELOR'S DEGREE
77.3/ 100
METRIC RATING
150th/ 347
METRIC RANK
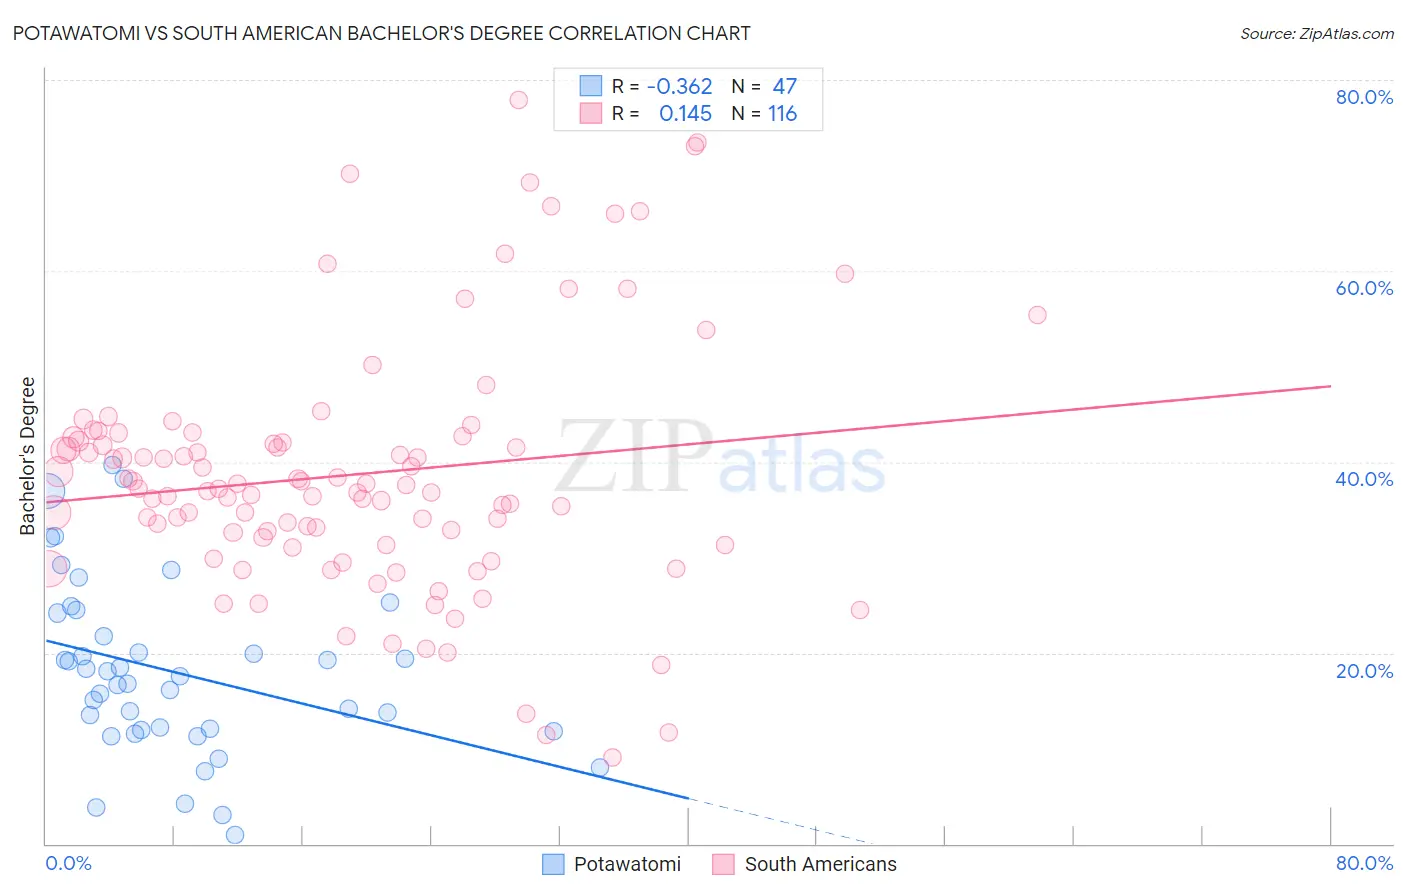
Potawatomi vs South American Bachelor's Degree Correlation Chart
The statistical analysis conducted on geographies consisting of 117,773,137 people shows a mild negative correlation between the proportion of Potawatomi and percentage of population with at least bachelor's degree education in the United States with a correlation coefficient (R) of -0.362 and weighted average of 31.9%. Similarly, the statistical analysis conducted on geographies consisting of 494,094,255 people shows a poor positive correlation between the proportion of South Americans and percentage of population with at least bachelor's degree education in the United States with a correlation coefficient (R) of 0.145 and weighted average of 38.9%, a difference of 22.3%.
Bachelor's Degree Correlation Summary
| Measurement | Potawatomi | South American |
| Minimum | 0.98% | 9.1% |
| Maximum | 39.6% | 77.9% |
| Range | 38.6% | 68.8% |
| Mean | 18.0% | 38.6% |
| Median | 17.5% | 37.2% |
| Interquartile 25% (IQ1) | 11.9% | 31.7% |
| Interquartile 75% (IQ3) | 24.2% | 42.4% |
| Interquartile Range (IQR) | 12.3% | 10.7% |
| Standard Deviation (Sample) | 9.0% | 13.0% |
| Standard Deviation (Population) | 8.9% | 12.9% |
Similar Demographics by Bachelor's Degree
Demographics Similar to Potawatomi by Bachelor's Degree
In terms of bachelor's degree, the demographic groups most similar to Potawatomi are American (31.9%, a difference of 0.020%), Samoan (31.8%, a difference of 0.13%), Comanche (31.9%, a difference of 0.14%), Central American (31.9%, a difference of 0.17%), and Salvadoran (31.8%, a difference of 0.17%).
| Demographics | Rating | Rank | Bachelor's Degree |
| Cubans | 0.3 /100 | #267 | Tragic 32.5% |
| Immigrants | Portugal | 0.2 /100 | #268 | Tragic 32.2% |
| Immigrants | Belize | 0.2 /100 | #269 | Tragic 32.1% |
| Immigrants | Nicaragua | 0.2 /100 | #270 | Tragic 31.9% |
| Central Americans | 0.2 /100 | #271 | Tragic 31.9% |
| Comanche | 0.2 /100 | #272 | Tragic 31.9% |
| Americans | 0.2 /100 | #273 | Tragic 31.9% |
| Potawatomi | 0.2 /100 | #274 | Tragic 31.9% |
| Samoans | 0.1 /100 | #275 | Tragic 31.8% |
| Salvadorans | 0.1 /100 | #276 | Tragic 31.8% |
| Dominicans | 0.1 /100 | #277 | Tragic 31.8% |
| Marshallese | 0.1 /100 | #278 | Tragic 31.7% |
| Hawaiians | 0.1 /100 | #279 | Tragic 31.6% |
| Immigrants | Laos | 0.1 /100 | #280 | Tragic 31.6% |
| Blackfeet | 0.1 /100 | #281 | Tragic 31.5% |
Demographics Similar to South Americans by Bachelor's Degree
In terms of bachelor's degree, the demographic groups most similar to South Americans are Immigrants from Poland (39.0%, a difference of 0.030%), Immigrants from Africa (38.9%, a difference of 0.10%), Iraqi (39.0%, a difference of 0.11%), Sudanese (38.9%, a difference of 0.12%), and Slavic (38.9%, a difference of 0.18%).
| Demographics | Rating | Rank | Bachelor's Degree |
| Poles | 79.8 /100 | #143 | Good 39.1% |
| Immigrants | Afghanistan | 79.7 /100 | #144 | Good 39.1% |
| Slovenes | 79.5 /100 | #145 | Good 39.1% |
| Swedes | 79.2 /100 | #146 | Good 39.1% |
| Immigrants | Sierra Leone | 79.0 /100 | #147 | Good 39.0% |
| Iraqis | 78.1 /100 | #148 | Good 39.0% |
| Immigrants | Poland | 77.5 /100 | #149 | Good 39.0% |
| South Americans | 77.3 /100 | #150 | Good 38.9% |
| Immigrants | Africa | 76.5 /100 | #151 | Good 38.9% |
| Sudanese | 76.4 /100 | #152 | Good 38.9% |
| Slavs | 75.9 /100 | #153 | Good 38.9% |
| Canadians | 75.0 /100 | #154 | Good 38.8% |
| Immigrants | Kenya | 73.8 /100 | #155 | Good 38.8% |
| Kenyans | 72.5 /100 | #156 | Good 38.7% |
| Immigrants | South America | 70.1 /100 | #157 | Good 38.6% |