Potawatomi vs Immigrants from Northern Europe Bachelor's Degree
COMPARE
Potawatomi
Immigrants from Northern Europe
Bachelor's Degree
Bachelor's Degree Comparison
Potawatomi
Immigrants from Northern Europe
31.9%
BACHELOR'S DEGREE
0.2/ 100
METRIC RATING
274th/ 347
METRIC RANK
45.6%
BACHELOR'S DEGREE
100.0/ 100
METRIC RATING
33rd/ 347
METRIC RANK
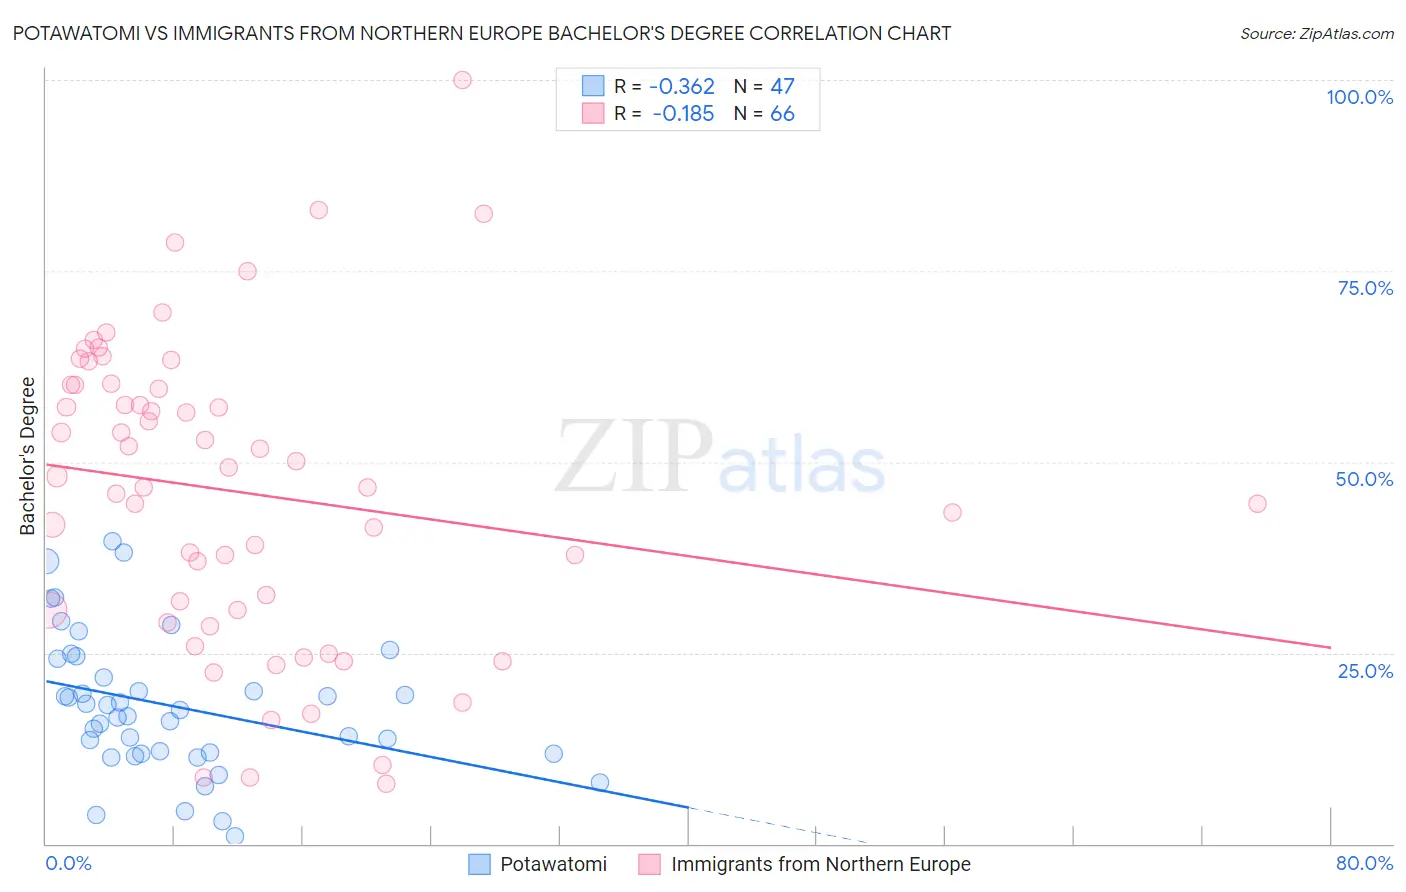
Potawatomi vs Immigrants from Northern Europe Bachelor's Degree Correlation Chart
The statistical analysis conducted on geographies consisting of 117,773,137 people shows a mild negative correlation between the proportion of Potawatomi and percentage of population with at least bachelor's degree education in the United States with a correlation coefficient (R) of -0.362 and weighted average of 31.9%. Similarly, the statistical analysis conducted on geographies consisting of 477,184,497 people shows a poor negative correlation between the proportion of Immigrants from Northern Europe and percentage of population with at least bachelor's degree education in the United States with a correlation coefficient (R) of -0.185 and weighted average of 45.6%, a difference of 43.2%.
Bachelor's Degree Correlation Summary
| Measurement | Potawatomi | Immigrants from Northern Europe |
| Minimum | 0.98% | 7.8% |
| Maximum | 39.6% | 100.0% |
| Range | 38.6% | 92.2% |
| Mean | 18.0% | 46.0% |
| Median | 17.5% | 47.4% |
| Interquartile 25% (IQ1) | 11.9% | 30.6% |
| Interquartile 75% (IQ3) | 24.2% | 60.1% |
| Interquartile Range (IQR) | 12.3% | 29.5% |
| Standard Deviation (Sample) | 9.0% | 20.0% |
| Standard Deviation (Population) | 8.9% | 19.8% |
Similar Demographics by Bachelor's Degree
Demographics Similar to Potawatomi by Bachelor's Degree
In terms of bachelor's degree, the demographic groups most similar to Potawatomi are American (31.9%, a difference of 0.020%), Samoan (31.8%, a difference of 0.13%), Comanche (31.9%, a difference of 0.14%), Central American (31.9%, a difference of 0.17%), and Salvadoran (31.8%, a difference of 0.17%).
| Demographics | Rating | Rank | Bachelor's Degree |
| Cubans | 0.3 /100 | #267 | Tragic 32.5% |
| Immigrants | Portugal | 0.2 /100 | #268 | Tragic 32.2% |
| Immigrants | Belize | 0.2 /100 | #269 | Tragic 32.1% |
| Immigrants | Nicaragua | 0.2 /100 | #270 | Tragic 31.9% |
| Central Americans | 0.2 /100 | #271 | Tragic 31.9% |
| Comanche | 0.2 /100 | #272 | Tragic 31.9% |
| Americans | 0.2 /100 | #273 | Tragic 31.9% |
| Potawatomi | 0.2 /100 | #274 | Tragic 31.9% |
| Samoans | 0.1 /100 | #275 | Tragic 31.8% |
| Salvadorans | 0.1 /100 | #276 | Tragic 31.8% |
| Dominicans | 0.1 /100 | #277 | Tragic 31.8% |
| Marshallese | 0.1 /100 | #278 | Tragic 31.7% |
| Hawaiians | 0.1 /100 | #279 | Tragic 31.6% |
| Immigrants | Laos | 0.1 /100 | #280 | Tragic 31.6% |
| Blackfeet | 0.1 /100 | #281 | Tragic 31.5% |
Demographics Similar to Immigrants from Northern Europe by Bachelor's Degree
In terms of bachelor's degree, the demographic groups most similar to Immigrants from Northern Europe are Immigrants from Denmark (45.4%, a difference of 0.45%), Immigrants from Russia (45.4%, a difference of 0.48%), Mongolian (45.4%, a difference of 0.50%), Russian (45.3%, a difference of 0.65%), and Immigrants from Turkey (46.0%, a difference of 0.70%).
| Demographics | Rating | Rank | Bachelor's Degree |
| Immigrants | Japan | 100.0 /100 | #26 | Exceptional 46.8% |
| Immigrants | France | 100.0 /100 | #27 | Exceptional 46.4% |
| Turks | 100.0 /100 | #28 | Exceptional 46.2% |
| Israelis | 100.0 /100 | #29 | Exceptional 46.1% |
| Immigrants | Sri Lanka | 100.0 /100 | #30 | Exceptional 46.1% |
| Latvians | 100.0 /100 | #31 | Exceptional 46.1% |
| Immigrants | Turkey | 100.0 /100 | #32 | Exceptional 46.0% |
| Immigrants | Northern Europe | 100.0 /100 | #33 | Exceptional 45.6% |
| Immigrants | Denmark | 100.0 /100 | #34 | Exceptional 45.4% |
| Immigrants | Russia | 100.0 /100 | #35 | Exceptional 45.4% |
| Mongolians | 100.0 /100 | #36 | Exceptional 45.4% |
| Russians | 100.0 /100 | #37 | Exceptional 45.3% |
| Bulgarians | 100.0 /100 | #38 | Exceptional 45.3% |
| Immigrants | Latvia | 100.0 /100 | #39 | Exceptional 45.1% |
| Immigrants | Belarus | 100.0 /100 | #40 | Exceptional 45.0% |