Bolivian vs Nigerian Bachelor's Degree

COMPARE

Bolivian
Race
Ancestry
AfghanAfricanAlaska NativeAlaskan AthabascanAlbanianAleutAlsatianAmericanApacheArabArapahoArgentineanArmenianAssyrian/Chaldean/SyriacAustralianAustrianBahamianBangladeshiBarbadianBasqueBelgianBelizeanBermudanBhutaneseBlackfeetBolivianBrazilianBritishBritish West IndianBulgarianBurmeseCajunCambodianCanadianCape VerdeanCarpatho RusynCelticCentral AmericanCentral American IndianCherokeeCheyenneChickasawChileanChineseChippewaChoctawColombianColvilleComancheCosta RicanCreeCreekCroatianCrowCubanCypriotCzechCzechoslovakianDanishDelawareDominicanDutchDutch West IndianEastern EuropeanEcuadorianEgyptianEnglishEstonianEthiopianEuropeanFijianFilipinoFinnishFrenchFrench American IndianFrench CanadianGermanGerman RussianGhanaianGreekGuamanian/ChamorroGuatemalanGuyaneseHaitianHmongHonduranHopiHoumaHungarianIcelanderIndian (Asian)IndonesianInupiatIranianIraqiIrishIroquoisIsraeliItalianJamaicanJapaneseJordanianKenyanKiowaKoreanLaotianLatvianLebaneseLiberianLithuanianLumbeeLuxembourgerMacedonianMalaysianMalteseMarshalleseMenomineeMexicanMexican American IndianMongolianMoroccanNative HawaiianNavajoNepaleseNew ZealanderNicaraguanNorthern EuropeanNorwegianOkinawanOsageOttawaPaiutePakistaniPalestinianPanamanianParaguayanPennsylvania GermanPeruvianPimaPolishPortuguesePotawatomiPuebloPuerto RicanPuget Sound SalishRomanianRussianSalvadoranSamoanScandinavianScotch-IrishScottishSeminoleSenegaleseSerbianShoshoneSierra LeoneanSiouxSlavicSlovakSloveneSomaliSouth AfricanSouth AmericanSouth American IndianSoviet UnionSpaniardSpanishSpanish AmericanSpanish American IndianSri LankanSubsaharan AfricanSudaneseSwedishSwissSyrianTaiwaneseThaiTlingit-HaidaTohono O'OdhamTonganTrinidadian and TobagonianTsimshianTurkishU.S. Virgin IslanderUgandanUkrainianUruguayanUteVenezuelanVietnameseWelshWest IndianYakamaYaquiYugoslavianYumanYup'ikZimbabwean
Immigration
NonimmigrantsImmigrantsAfghanistanAfricaAlbaniaArgentinaArmeniaAsiaAustraliaAustriaBahamasBangladeshBarbadosBelarusBelgiumBelizeBoliviaBosnia and HerzegovinaBrazilBulgariaBurma/MyanmarCabo VerdeCambodiaCameroonCanadaCaribbeanCentral AmericaChileChinaColombiaCongoCosta RicaCroatiaCubaCzechoslovakiaDenmarkDominicaDominican RepublicEastern AfricaEastern AsiaEastern EuropeEcuadorEgyptEl SalvadorEnglandEritreaEthiopiaEuropeFijiFranceGermanyGhanaGreeceGrenadaGuatemalaGuyanaHaitiHondurasHong KongHungaryIndiaIndonesiaIranIraqIrelandIsraelItalyJamaicaJapanJordanKazakhstanKenyaKoreaKuwaitLaosLatin AmericaLatviaLebanonLiberiaLithuaniaMalaysiaMexicoMicronesiaMiddle AfricaMoldovaMoroccoNepalNetherlandsNicaraguaNigeriaNorth AmericaNorth MacedoniaNorthern AfricaNorthern EuropeNorwayOceaniaPakistanPanamaPeruPhilippinesPolandPortugalRomaniaRussiaSaudi ArabiaScotlandSenegalSerbiaSierra LeoneSingaporeSomaliaSouth AfricaSouth AmericaSouth Central AsiaSouth Eastern AsiaSouthern EuropeSpainSri LankaSt. Vincent and the GrenadinesSudanSwedenSwitzerlandSyriaTaiwanThailandTrinidad and TobagoTurkeyUgandaUkraineUruguayUzbekistanVenezuelaVietnamWest IndiesWestern AfricaWestern AsiaWestern EuropeYemenZaireZimbabweAzores
Nigerian
Race
Ancestry
AfghanAfricanAlaska NativeAlaskan AthabascanAlbanianAleutAlsatianAmericanApacheArabArapahoArgentineanArmenianAssyrian/Chaldean/SyriacAustralianAustrianBahamianBangladeshiBarbadianBasqueBelgianBelizeanBermudanBhutaneseBlackfeetBrazilianBritishBritish West IndianBulgarianBurmeseCajunCambodianCanadianCape VerdeanCarpatho RusynCelticCentral AmericanCentral American IndianCherokeeCheyenneChickasawChileanChineseChippewaChoctawColombianColvilleComancheCosta RicanCreeCreekCroatianCrowCubanCypriotCzechCzechoslovakianDanishDelawareDominicanDutchDutch West IndianEastern EuropeanEcuadorianEgyptianEnglishEstonianEthiopianEuropeanFijianFilipinoFinnishFrenchFrench American IndianFrench CanadianGermanGerman RussianGhanaianGreekGuamanian/ChamorroGuatemalanGuyaneseHaitianHmongHonduranHopiHoumaHungarianIcelanderIndian (Asian)IndonesianInupiatIranianIraqiIrishIroquoisIsraeliItalianJamaicanJapaneseJordanianKenyanKiowaKoreanLaotianLatvianLebaneseLiberianLithuanianLumbeeLuxembourgerMacedonianMalaysianMalteseMarshalleseMenomineeMexicanMexican American IndianMongolianMoroccanNative HawaiianNavajoNepaleseNew ZealanderNicaraguanNigerianNorthern EuropeanNorwegianOkinawanOsageOttawaPaiutePakistaniPalestinianPanamanianParaguayanPennsylvania GermanPeruvianPimaPolishPortuguesePotawatomiPuebloPuerto RicanPuget Sound SalishRomanianRussianSalvadoranSamoanScandinavianScotch-IrishScottishSeminoleSenegaleseSerbianShoshoneSierra LeoneanSiouxSlavicSlovakSloveneSomaliSouth AfricanSouth AmericanSouth American IndianSoviet UnionSpaniardSpanishSpanish AmericanSpanish American IndianSri LankanSubsaharan AfricanSudaneseSwedishSwissSyrianTaiwaneseThaiTlingit-HaidaTohono O'OdhamTonganTrinidadian and TobagonianTsimshianTurkishU.S. Virgin IslanderUgandanUkrainianUruguayanUteVenezuelanVietnameseWelshWest IndianYakamaYaquiYugoslavianYumanYup'ikZimbabwean
Immigration
NonimmigrantsImmigrantsAfghanistanAfricaAlbaniaArgentinaArmeniaAsiaAustraliaAustriaBahamasBangladeshBarbadosBelarusBelgiumBelizeBoliviaBosnia and HerzegovinaBrazilBulgariaBurma/MyanmarCabo VerdeCambodiaCameroonCanadaCaribbeanCentral AmericaChileChinaColombiaCongoCosta RicaCroatiaCubaCzechoslovakiaDenmarkDominicaDominican RepublicEastern AfricaEastern AsiaEastern EuropeEcuadorEgyptEl SalvadorEnglandEritreaEthiopiaEuropeFijiFranceGermanyGhanaGreeceGrenadaGuatemalaGuyanaHaitiHondurasHong KongHungaryIndiaIndonesiaIranIraqIrelandIsraelItalyJamaicaJapanJordanKazakhstanKenyaKoreaKuwaitLaosLatin AmericaLatviaLebanonLiberiaLithuaniaMalaysiaMexicoMicronesiaMiddle AfricaMoldovaMoroccoNepalNetherlandsNicaraguaNigeriaNorth AmericaNorth MacedoniaNorthern AfricaNorthern EuropeNorwayOceaniaPakistanPanamaPeruPhilippinesPolandPortugalRomaniaRussiaSaudi ArabiaScotlandSenegalSerbiaSierra LeoneSingaporeSomaliaSouth AfricaSouth AmericaSouth Central AsiaSouth Eastern AsiaSouthern EuropeSpainSri LankaSt. Vincent and the GrenadinesSudanSwedenSwitzerlandSyriaTaiwanThailandTrinidad and TobagoTurkeyUgandaUkraineUruguayUzbekistanVenezuelaVietnamWest IndiesWestern AfricaWestern AsiaWestern EuropeYemenZaireZimbabweAzores
Bachelor's Degree
Income
Poverty
Unemployment
Labor Participation
Family Structure
Vehicle Availability
Education Level
Disability

Bachelor's Degree Comparison

Bolivians

Nigerians

Exceptional
Fair
44.6%
BACHELOR'S DEGREE
99.9/ 100
METRIC RATING
47th/ 347
METRIC RANK
37.2%
BACHELOR'S DEGREE
33.9/ 100
METRIC RATING
191st/ 347
METRIC RANK

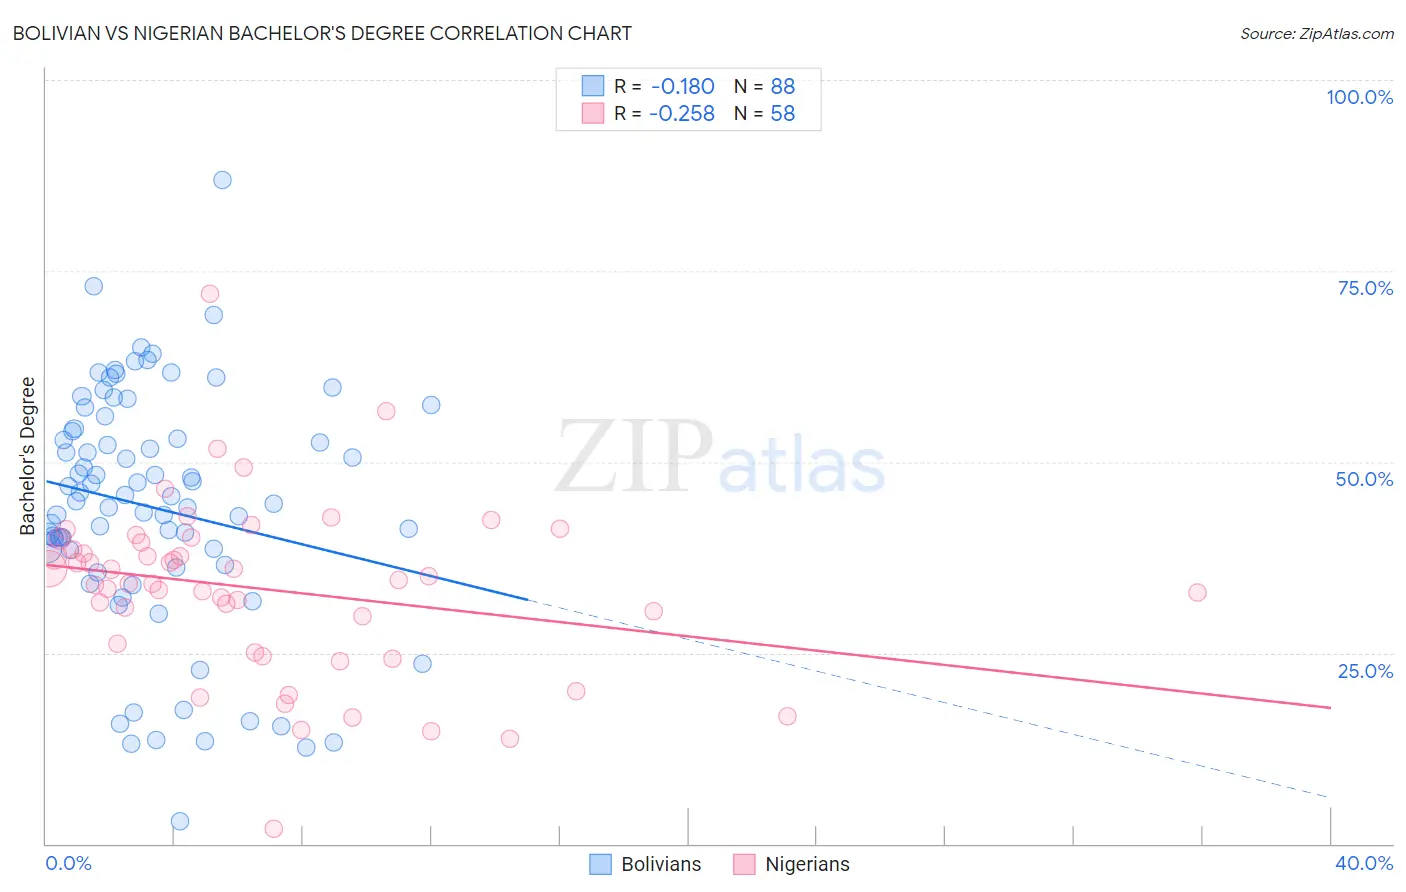
Bolivian vs Nigerian Bachelor's Degree Correlation Chart

The statistical analysis conducted on geographies consisting of 184,660,995 people shows a poor negative correlation between the proportion of Bolivians and percentage of population with at least bachelor's degree education in the United States with a correlation coefficient (R) of -0.180 and weighted average of 44.6%. Similarly, the statistical analysis conducted on geographies consisting of 332,744,449 people shows a weak negative correlation between the proportion of Nigerians and percentage of population with at least bachelor's degree education in the United States with a correlation coefficient (R) of -0.258 and weighted average of 37.2%, a difference of 19.8%.
Bolivian vs Nigerian Bachelor's Degree

Bachelor's Degree Correlation Summary

MeasurementBolivianNigerian
Minimum2.9%2.0%
Maximum86.9%72.0%
Range83.9%70.0%
Mean44.0%33.4%
Median45.2%34.3%
Interquartile 25% (IQ1)37.5%26.1%
Interquartile 75% (IQ3)54.2%39.4%
Interquartile Range (IQR)16.7%13.3%
Standard Deviation (Sample)15.8%11.4%
Standard Deviation (Population)15.7%11.3%

Similar Demographics by Bachelor's Degree

Demographics Similar to Bolivians by Bachelor's Degree

In terms of bachelor's degree, the demographic groups most similar to Bolivians are Estonian (44.6%, a difference of 0.0%), Immigrants from Bulgaria (44.6%, a difference of 0.040%), Immigrants from Kuwait (44.6%, a difference of 0.090%), Immigrants from Lithuania (44.6%, a difference of 0.12%), and Immigrants from Norway (44.5%, a difference of 0.12%).
DemographicsRating | RankBachelor's Degree
Immigrants | Belarus
100.0
/100
|
#40
Exceptional
45.0%
Immigrants | Malaysia
100.0
/100
|
#41
Exceptional
45.0%
Immigrants | Saudi Arabia
100.0
/100
|
#42
Exceptional
44.8%
Immigrants | South Africa
99.9
/100
|
#43
Exceptional
44.8%
Immigrants | Lithuania
99.9
/100
|
#44
Exceptional
44.6%
Immigrants | Kuwait
99.9
/100
|
#45
Exceptional
44.6%
Immigrants | Bulgaria
99.9
/100
|
#46
Exceptional
44.6%
Bolivians
99.9
/100
|
#47
Exceptional
44.6%
Estonians
99.9
/100
|
#48
Exceptional
44.6%
Immigrants | Norway
99.9
/100
|
#49
Exceptional
44.5%
Immigrants | Greece
99.9
/100
|
#50
Exceptional
44.5%
Asians
99.9
/100
|
#51
Exceptional
44.4%
Immigrants | Spain
99.9
/100
|
#52
Exceptional
44.3%
Immigrants | Asia
99.9
/100
|
#53
Exceptional
44.3%
Immigrants | Austria
99.9
/100
|
#54
Exceptional
44.2%

Demographics Similar to Nigerians by Bachelor's Degree

In terms of bachelor's degree, the demographic groups most similar to Nigerians are Swiss (37.2%, a difference of 0.020%), Immigrants from Vietnam (37.1%, a difference of 0.20%), Yugoslavian (37.1%, a difference of 0.27%), Slovak (37.3%, a difference of 0.32%), and Immigrants from Oceania (37.3%, a difference of 0.37%).
DemographicsRating | RankBachelor's Degree
Scandinavians
41.7
/100
|
#184
Average
37.5%
Immigrants | Peru
41.3
/100
|
#185
Average
37.5%
Norwegians
40.4
/100
|
#186
Average
37.5%
English
39.7
/100
|
#187
Fair
37.4%
Immigrants | Oceania
37.3
/100
|
#188
Fair
37.3%
Slovaks
36.9
/100
|
#189
Fair
37.3%
Swiss
34.1
/100
|
#190
Fair
37.2%
Nigerians
33.9
/100
|
#191
Fair
37.2%
Immigrants | Vietnam
32.1
/100
|
#192
Fair
37.1%
Yugoslavians
31.5
/100
|
#193
Fair
37.1%
Belgians
29.9
/100
|
#194
Fair
37.0%
Koreans
29.8
/100
|
#195
Fair
37.0%
Celtics
29.5
/100
|
#196
Fair
37.0%
Czechoslovakians
29.2
/100
|
#197
Fair
37.0%
Welsh
29.1
/100
|
#198
Fair
37.0%