Immigrants from Venezuela vs Nigerian Bachelor's Degree
COMPARE
Immigrants from Venezuela
Nigerian
Bachelor's Degree
Bachelor's Degree Comparison
Immigrants from Venezuela
Nigerians
40.2%
BACHELOR'S DEGREE
92.9/ 100
METRIC RATING
128th/ 347
METRIC RANK
37.2%
BACHELOR'S DEGREE
33.9/ 100
METRIC RATING
191st/ 347
METRIC RANK
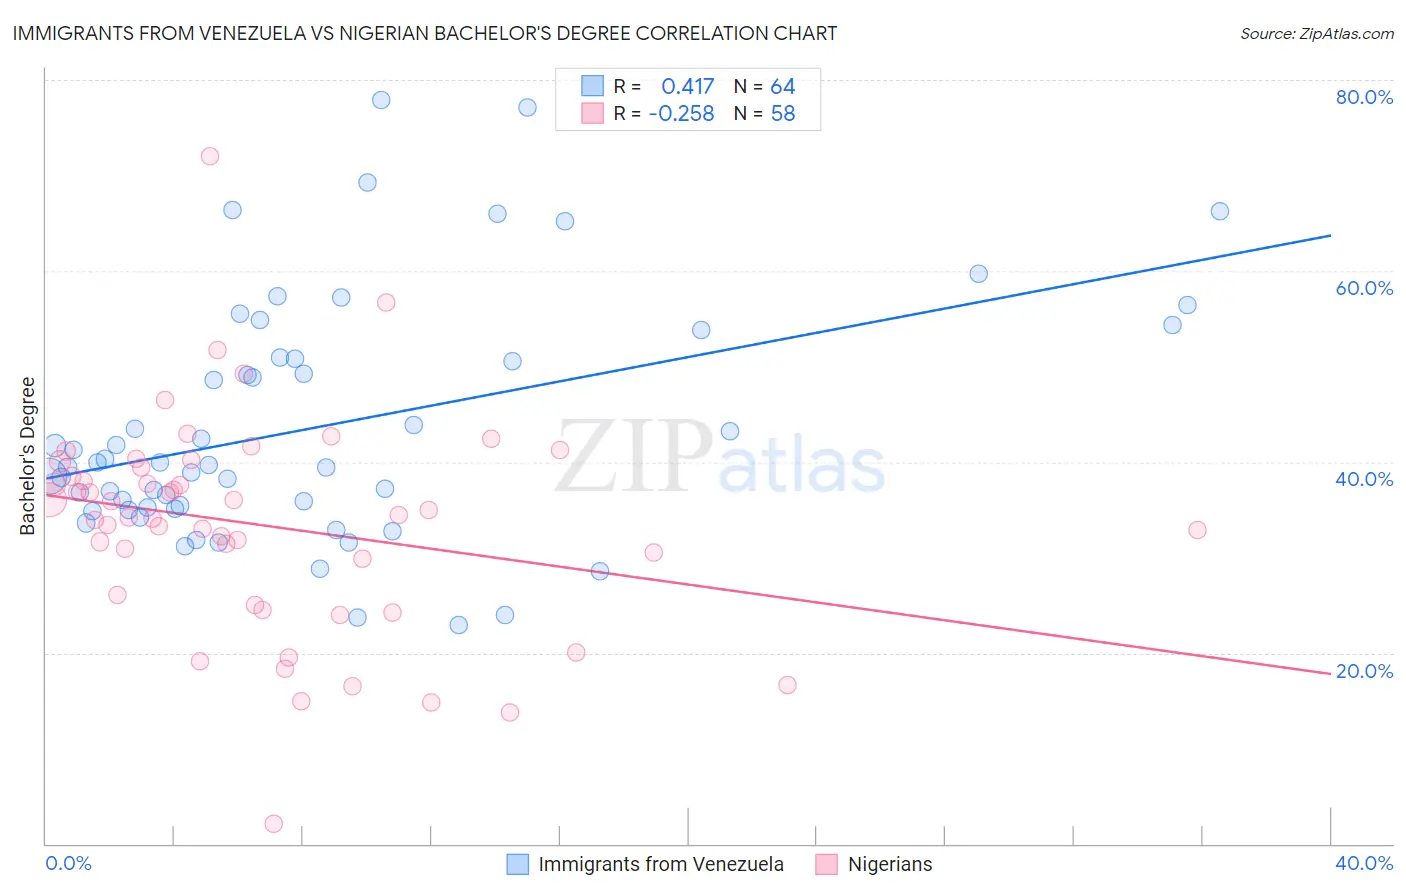
Immigrants from Venezuela vs Nigerian Bachelor's Degree Correlation Chart
The statistical analysis conducted on geographies consisting of 287,853,697 people shows a moderate positive correlation between the proportion of Immigrants from Venezuela and percentage of population with at least bachelor's degree education in the United States with a correlation coefficient (R) of 0.417 and weighted average of 40.2%. Similarly, the statistical analysis conducted on geographies consisting of 332,744,449 people shows a weak negative correlation between the proportion of Nigerians and percentage of population with at least bachelor's degree education in the United States with a correlation coefficient (R) of -0.258 and weighted average of 37.2%, a difference of 8.0%.
Bachelor's Degree Correlation Summary
| Measurement | Immigrants from Venezuela | Nigerian |
| Minimum | 22.9% | 2.0% |
| Maximum | 77.9% | 72.0% |
| Range | 55.1% | 70.0% |
| Mean | 43.7% | 33.4% |
| Median | 39.8% | 34.3% |
| Interquartile 25% (IQ1) | 35.2% | 26.1% |
| Interquartile 75% (IQ3) | 50.9% | 39.4% |
| Interquartile Range (IQR) | 15.7% | 13.3% |
| Standard Deviation (Sample) | 12.7% | 11.4% |
| Standard Deviation (Population) | 12.6% | 11.3% |
Similar Demographics by Bachelor's Degree
Demographics Similar to Immigrants from Venezuela by Bachelor's Degree
In terms of bachelor's degree, the demographic groups most similar to Immigrants from Venezuela are Immigrants from Jordan (40.3%, a difference of 0.17%), Serbian (40.1%, a difference of 0.17%), Sierra Leonean (40.1%, a difference of 0.24%), Italian (40.1%, a difference of 0.32%), and Immigrants from Eastern Africa (40.4%, a difference of 0.46%).
| Demographics | Rating | Rank | Bachelor's Degree |
| Moroccans | 94.6 /100 | #121 | Exceptional 40.5% |
| Immigrants | Albania | 94.4 /100 | #122 | Exceptional 40.4% |
| Lebanese | 94.3 /100 | #123 | Exceptional 40.4% |
| Immigrants | Eritrea | 94.3 /100 | #124 | Exceptional 40.4% |
| British | 94.2 /100 | #125 | Exceptional 40.4% |
| Immigrants | Eastern Africa | 94.1 /100 | #126 | Exceptional 40.4% |
| Immigrants | Jordan | 93.4 /100 | #127 | Exceptional 40.3% |
| Immigrants | Venezuela | 92.9 /100 | #128 | Exceptional 40.2% |
| Serbians | 92.4 /100 | #129 | Exceptional 40.1% |
| Sierra Leoneans | 92.2 /100 | #130 | Exceptional 40.1% |
| Italians | 91.9 /100 | #131 | Exceptional 40.1% |
| Taiwanese | 91.1 /100 | #132 | Exceptional 40.0% |
| Immigrants | Southern Europe | 91.1 /100 | #133 | Exceptional 40.0% |
| Assyrians/Chaldeans/Syriacs | 89.4 /100 | #134 | Excellent 39.8% |
| Luxembourgers | 89.1 /100 | #135 | Excellent 39.8% |
Demographics Similar to Nigerians by Bachelor's Degree
In terms of bachelor's degree, the demographic groups most similar to Nigerians are Swiss (37.2%, a difference of 0.020%), Immigrants from Vietnam (37.1%, a difference of 0.20%), Yugoslavian (37.1%, a difference of 0.27%), Slovak (37.3%, a difference of 0.32%), and Immigrants from Oceania (37.3%, a difference of 0.37%).
| Demographics | Rating | Rank | Bachelor's Degree |
| Scandinavians | 41.7 /100 | #184 | Average 37.5% |
| Immigrants | Peru | 41.3 /100 | #185 | Average 37.5% |
| Norwegians | 40.4 /100 | #186 | Average 37.5% |
| English | 39.7 /100 | #187 | Fair 37.4% |
| Immigrants | Oceania | 37.3 /100 | #188 | Fair 37.3% |
| Slovaks | 36.9 /100 | #189 | Fair 37.3% |
| Swiss | 34.1 /100 | #190 | Fair 37.2% |
| Nigerians | 33.9 /100 | #191 | Fair 37.2% |
| Immigrants | Vietnam | 32.1 /100 | #192 | Fair 37.1% |
| Yugoslavians | 31.5 /100 | #193 | Fair 37.1% |
| Belgians | 29.9 /100 | #194 | Fair 37.0% |
| Koreans | 29.8 /100 | #195 | Fair 37.0% |
| Celtics | 29.5 /100 | #196 | Fair 37.0% |
| Czechoslovakians | 29.2 /100 | #197 | Fair 37.0% |
| Welsh | 29.1 /100 | #198 | Fair 37.0% |