Pima vs Immigrants from Netherlands 7th Grade
COMPARE
Pima
Immigrants from Netherlands
7th Grade
7th Grade Comparison
Pima
Immigrants from Netherlands
96.1%
7TH GRADE
64.3/ 100
METRIC RATING
162nd/ 347
METRIC RANK
96.8%
7TH GRADE
99.3/ 100
METRIC RATING
78th/ 347
METRIC RANK
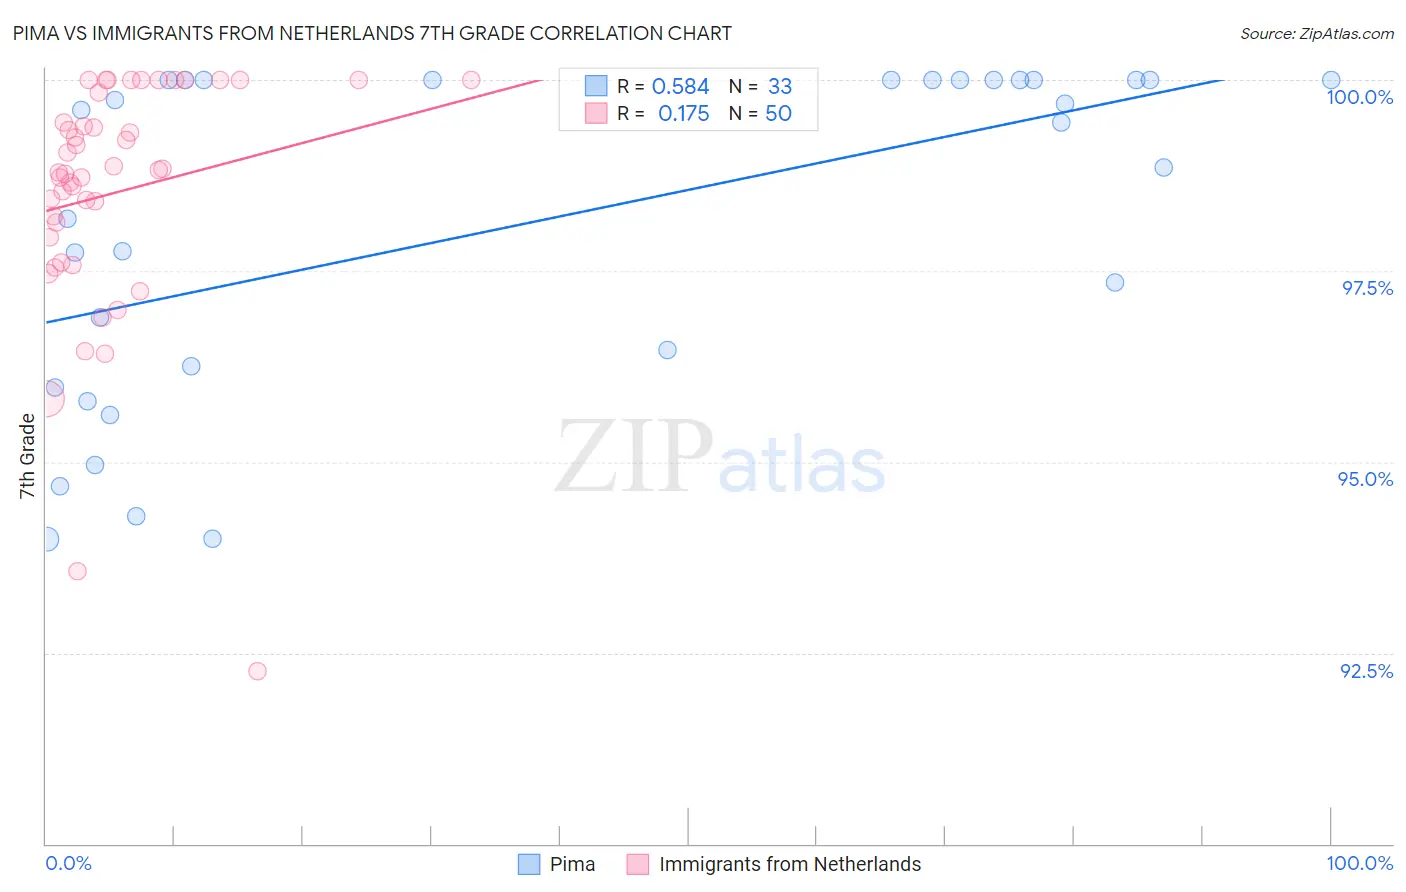
Pima vs Immigrants from Netherlands 7th Grade Correlation Chart
The statistical analysis conducted on geographies consisting of 61,552,136 people shows a substantial positive correlation between the proportion of Pima and percentage of population with at least 7th grade education in the United States with a correlation coefficient (R) of 0.584 and weighted average of 96.1%. Similarly, the statistical analysis conducted on geographies consisting of 237,869,934 people shows a poor positive correlation between the proportion of Immigrants from Netherlands and percentage of population with at least 7th grade education in the United States with a correlation coefficient (R) of 0.175 and weighted average of 96.8%, a difference of 0.68%.
7th Grade Correlation Summary
| Measurement | Pima | Immigrants from Netherlands |
| Minimum | 94.0% | 92.3% |
| Maximum | 100.0% | 100.0% |
| Range | 6.0% | 7.7% |
| Mean | 98.1% | 98.5% |
| Median | 99.4% | 98.8% |
| Interquartile 25% (IQ1) | 96.1% | 97.9% |
| Interquartile 75% (IQ3) | 100.0% | 99.8% |
| Interquartile Range (IQR) | 3.9% | 1.9% |
| Standard Deviation (Sample) | 2.2% | 1.6% |
| Standard Deviation (Population) | 2.1% | 1.6% |
Similar Demographics by 7th Grade
Demographics Similar to Pima by 7th Grade
In terms of 7th grade, the demographic groups most similar to Pima are Bermudan (96.1%, a difference of 0.010%), Spaniard (96.1%, a difference of 0.010%), Immigrants from Italy (96.1%, a difference of 0.010%), Alsatian (96.1%, a difference of 0.020%), and Immigrants from Kenya (96.1%, a difference of 0.020%).
| Demographics | Rating | Rank | 7th Grade |
| Immigrants | Jordan | 77.0 /100 | #155 | Good 96.2% |
| Kenyans | 76.2 /100 | #156 | Good 96.2% |
| Ugandans | 75.5 /100 | #157 | Good 96.2% |
| Arabs | 68.6 /100 | #158 | Good 96.2% |
| Alsatians | 67.2 /100 | #159 | Good 96.1% |
| Immigrants | Kenya | 66.8 /100 | #160 | Good 96.1% |
| Bermudans | 66.3 /100 | #161 | Good 96.1% |
| Pima | 64.3 /100 | #162 | Good 96.1% |
| Spaniards | 62.6 /100 | #163 | Good 96.1% |
| Immigrants | Italy | 62.1 /100 | #164 | Good 96.1% |
| Immigrants | Taiwan | 61.5 /100 | #165 | Good 96.1% |
| Immigrants | Kazakhstan | 61.0 /100 | #166 | Good 96.1% |
| Immigrants | Sri Lanka | 59.9 /100 | #167 | Average 96.1% |
| Immigrants | Poland | 59.0 /100 | #168 | Average 96.1% |
| Ute | 55.8 /100 | #169 | Average 96.1% |
Demographics Similar to Immigrants from Netherlands by 7th Grade
In terms of 7th grade, the demographic groups most similar to Immigrants from Netherlands are Cypriot (96.8%, a difference of 0.0%), Yugoslavian (96.8%, a difference of 0.0%), Immigrants from Ireland (96.8%, a difference of 0.010%), Cherokee (96.8%, a difference of 0.010%), and Delaware (96.8%, a difference of 0.020%).
| Demographics | Rating | Rank | 7th Grade |
| Immigrants | Lithuania | 99.6 /100 | #71 | Exceptional 96.8% |
| Cajuns | 99.5 /100 | #72 | Exceptional 96.8% |
| Arapaho | 99.5 /100 | #73 | Exceptional 96.8% |
| Immigrants | England | 99.5 /100 | #74 | Exceptional 96.8% |
| Zimbabweans | 99.5 /100 | #75 | Exceptional 96.8% |
| Immigrants | Ireland | 99.4 /100 | #76 | Exceptional 96.8% |
| Cherokee | 99.4 /100 | #77 | Exceptional 96.8% |
| Immigrants | Netherlands | 99.3 /100 | #78 | Exceptional 96.8% |
| Cypriots | 99.3 /100 | #79 | Exceptional 96.8% |
| Yugoslavians | 99.3 /100 | #80 | Exceptional 96.8% |
| Delaware | 99.2 /100 | #81 | Exceptional 96.8% |
| Chickasaw | 99.2 /100 | #82 | Exceptional 96.7% |
| Icelanders | 99.1 /100 | #83 | Exceptional 96.7% |
| Romanians | 99.1 /100 | #84 | Exceptional 96.7% |
| Kiowa | 99.1 /100 | #85 | Exceptional 96.7% |