Polish vs Maltese Master's Degree
COMPARE
Polish
Maltese
Master's Degree
Master's Degree Comparison
Poles
Maltese
15.7%
MASTER'S DEGREE
85.0/ 100
METRIC RATING
141st/ 347
METRIC RANK
17.3%
MASTER'S DEGREE
99.3/ 100
METRIC RATING
87th/ 347
METRIC RANK
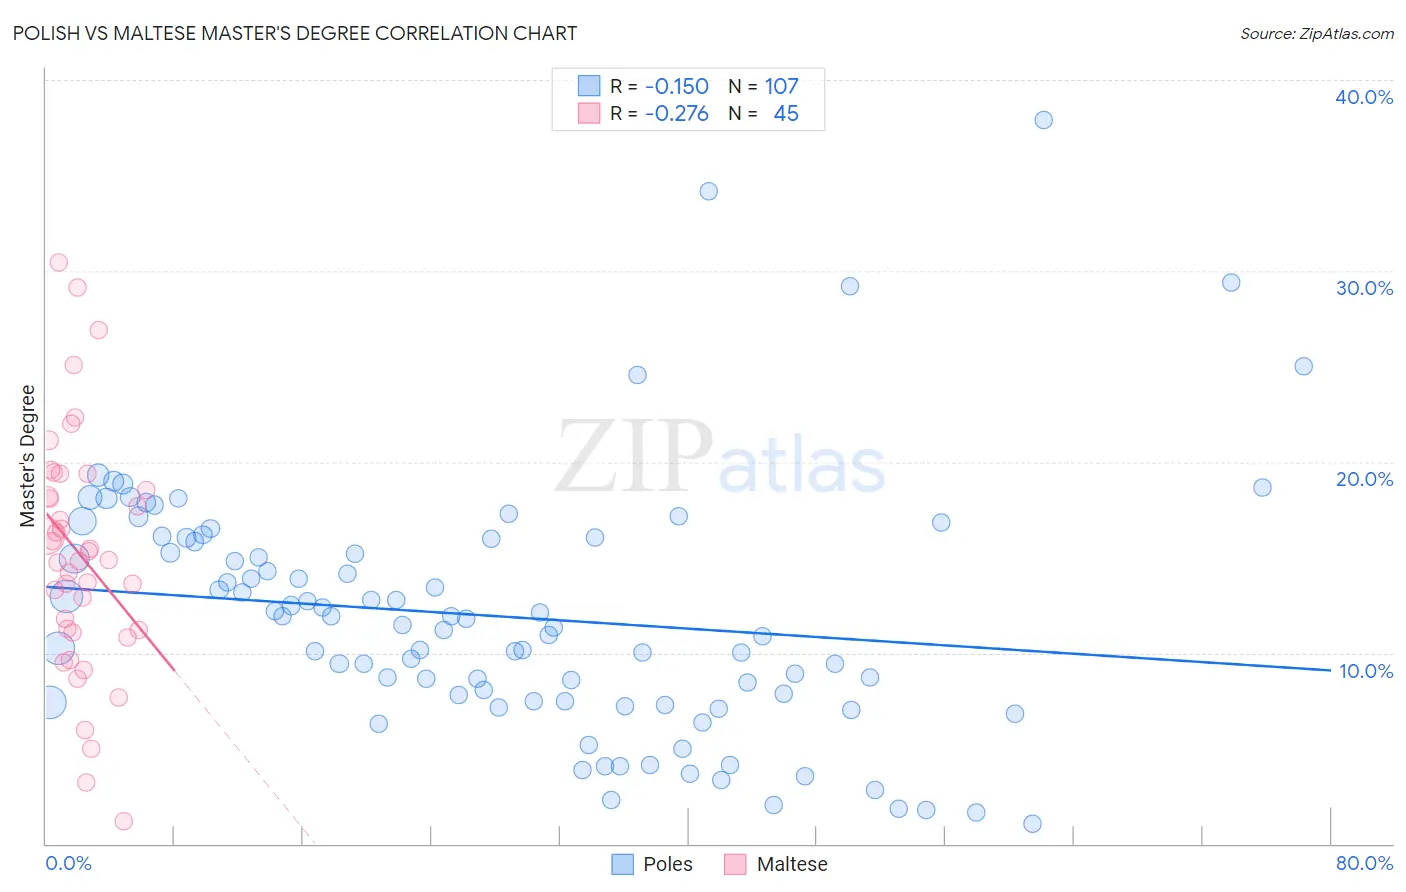
Polish vs Maltese Master's Degree Correlation Chart
The statistical analysis conducted on geographies consisting of 559,882,025 people shows a poor negative correlation between the proportion of Poles and percentage of population with at least master's degree education in the United States with a correlation coefficient (R) of -0.150 and weighted average of 15.7%. Similarly, the statistical analysis conducted on geographies consisting of 126,460,442 people shows a weak negative correlation between the proportion of Maltese and percentage of population with at least master's degree education in the United States with a correlation coefficient (R) of -0.276 and weighted average of 17.3%, a difference of 9.6%.
Master's Degree Correlation Summary
| Measurement | Polish | Maltese |
| Minimum | 1.0% | 1.2% |
| Maximum | 37.9% | 30.4% |
| Range | 36.9% | 29.2% |
| Mean | 11.9% | 15.1% |
| Median | 11.5% | 14.8% |
| Interquartile 25% (IQ1) | 7.4% | 11.1% |
| Interquartile 75% (IQ3) | 16.0% | 18.9% |
| Interquartile Range (IQR) | 8.5% | 7.8% |
| Standard Deviation (Sample) | 6.6% | 6.3% |
| Standard Deviation (Population) | 6.6% | 6.2% |
Similar Demographics by Master's Degree
Demographics Similar to Poles by Master's Degree
In terms of master's degree, the demographic groups most similar to Poles are Vietnamese (15.8%, a difference of 0.12%), Immigrants from Germany (15.8%, a difference of 0.21%), Immigrants from Africa (15.7%, a difference of 0.23%), Pakistani (15.8%, a difference of 0.27%), and Immigrants from Venezuela (15.7%, a difference of 0.32%).
| Demographics | Rating | Rank | Master's Degree |
| Venezuelans | 88.4 /100 | #134 | Excellent 15.9% |
| South American Indians | 88.4 /100 | #135 | Excellent 15.9% |
| Assyrians/Chaldeans/Syriacs | 86.8 /100 | #136 | Excellent 15.8% |
| Europeans | 86.4 /100 | #137 | Excellent 15.8% |
| Pakistanis | 86.1 /100 | #138 | Excellent 15.8% |
| Immigrants | Germany | 85.9 /100 | #139 | Excellent 15.8% |
| Vietnamese | 85.5 /100 | #140 | Excellent 15.8% |
| Poles | 85.0 /100 | #141 | Excellent 15.7% |
| Immigrants | Africa | 84.0 /100 | #142 | Excellent 15.7% |
| Immigrants | Venezuela | 83.6 /100 | #143 | Excellent 15.7% |
| Canadians | 83.3 /100 | #144 | Excellent 15.7% |
| South Americans | 81.3 /100 | #145 | Excellent 15.6% |
| Immigrants | Afghanistan | 79.4 /100 | #146 | Good 15.6% |
| Hungarians | 79.1 /100 | #147 | Good 15.6% |
| Immigrants | Senegal | 78.2 /100 | #148 | Good 15.5% |
Demographics Similar to Maltese by Master's Degree
In terms of master's degree, the demographic groups most similar to Maltese are Immigrants from Croatia (17.3%, a difference of 0.10%), Immigrants from Canada (17.2%, a difference of 0.36%), Bhutanese (17.2%, a difference of 0.43%), Immigrants from Egypt (17.2%, a difference of 0.45%), and Immigrants from Brazil (17.4%, a difference of 0.51%).
| Demographics | Rating | Rank | Master's Degree |
| Carpatho Rusyns | 99.6 /100 | #80 | Exceptional 17.5% |
| Immigrants | Western Asia | 99.5 /100 | #81 | Exceptional 17.5% |
| Greeks | 99.5 /100 | #82 | Exceptional 17.5% |
| Immigrants | Zimbabwe | 99.5 /100 | #83 | Exceptional 17.4% |
| Immigrants | Scotland | 99.4 /100 | #84 | Exceptional 17.4% |
| Immigrants | Brazil | 99.4 /100 | #85 | Exceptional 17.4% |
| Immigrants | Croatia | 99.3 /100 | #86 | Exceptional 17.3% |
| Maltese | 99.3 /100 | #87 | Exceptional 17.3% |
| Immigrants | Canada | 99.2 /100 | #88 | Exceptional 17.2% |
| Bhutanese | 99.1 /100 | #89 | Exceptional 17.2% |
| Immigrants | Egypt | 99.1 /100 | #90 | Exceptional 17.2% |
| Romanians | 99.1 /100 | #91 | Exceptional 17.2% |
| Immigrants | North America | 99.1 /100 | #92 | Exceptional 17.2% |
| Immigrants | Italy | 99.1 /100 | #93 | Exceptional 17.2% |
| Ugandans | 99.0 /100 | #94 | Exceptional 17.1% |