Polish vs Immigrants from Ukraine Master's Degree
COMPARE
Polish
Immigrants from Ukraine
Master's Degree
Master's Degree Comparison
Poles
Immigrants from Ukraine
15.7%
MASTER'S DEGREE
85.0/ 100
METRIC RATING
141st/ 347
METRIC RANK
17.0%
MASTER'S DEGREE
98.8/ 100
METRIC RATING
98th/ 347
METRIC RANK
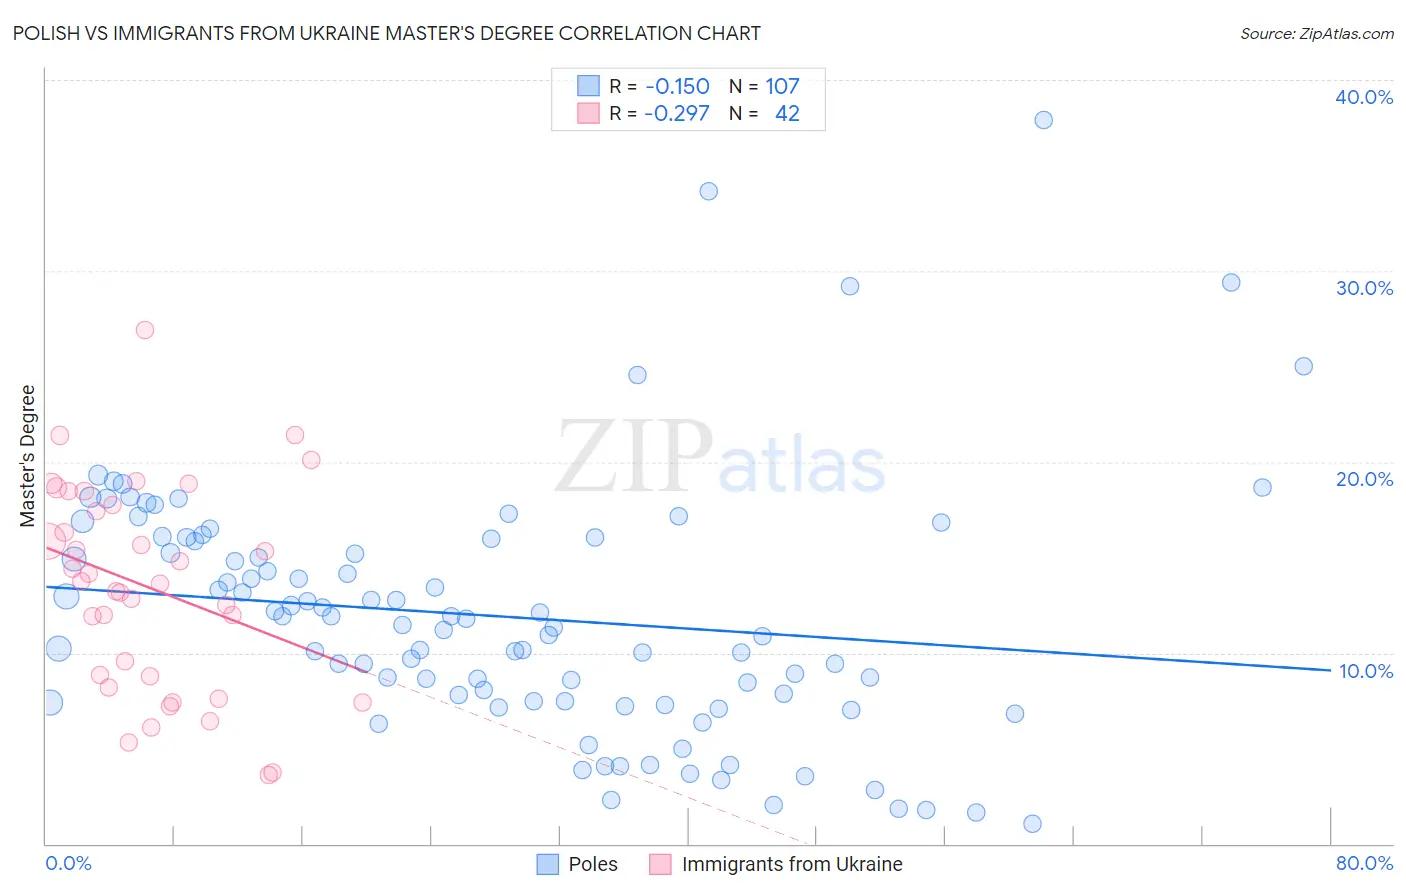
Polish vs Immigrants from Ukraine Master's Degree Correlation Chart
The statistical analysis conducted on geographies consisting of 559,882,025 people shows a poor negative correlation between the proportion of Poles and percentage of population with at least master's degree education in the United States with a correlation coefficient (R) of -0.150 and weighted average of 15.7%. Similarly, the statistical analysis conducted on geographies consisting of 289,678,550 people shows a weak negative correlation between the proportion of Immigrants from Ukraine and percentage of population with at least master's degree education in the United States with a correlation coefficient (R) of -0.297 and weighted average of 17.0%, a difference of 8.1%.
Master's Degree Correlation Summary
| Measurement | Polish | Immigrants from Ukraine |
| Minimum | 1.0% | 3.6% |
| Maximum | 37.9% | 26.9% |
| Range | 36.9% | 23.3% |
| Mean | 11.9% | 13.4% |
| Median | 11.5% | 13.7% |
| Interquartile 25% (IQ1) | 7.4% | 8.7% |
| Interquartile 75% (IQ3) | 16.0% | 17.7% |
| Interquartile Range (IQR) | 8.5% | 9.0% |
| Standard Deviation (Sample) | 6.6% | 5.4% |
| Standard Deviation (Population) | 6.6% | 5.3% |
Similar Demographics by Master's Degree
Demographics Similar to Poles by Master's Degree
In terms of master's degree, the demographic groups most similar to Poles are Vietnamese (15.8%, a difference of 0.12%), Immigrants from Germany (15.8%, a difference of 0.21%), Immigrants from Africa (15.7%, a difference of 0.23%), Pakistani (15.8%, a difference of 0.27%), and Immigrants from Venezuela (15.7%, a difference of 0.32%).
| Demographics | Rating | Rank | Master's Degree |
| Venezuelans | 88.4 /100 | #134 | Excellent 15.9% |
| South American Indians | 88.4 /100 | #135 | Excellent 15.9% |
| Assyrians/Chaldeans/Syriacs | 86.8 /100 | #136 | Excellent 15.8% |
| Europeans | 86.4 /100 | #137 | Excellent 15.8% |
| Pakistanis | 86.1 /100 | #138 | Excellent 15.8% |
| Immigrants | Germany | 85.9 /100 | #139 | Excellent 15.8% |
| Vietnamese | 85.5 /100 | #140 | Excellent 15.8% |
| Poles | 85.0 /100 | #141 | Excellent 15.7% |
| Immigrants | Africa | 84.0 /100 | #142 | Excellent 15.7% |
| Immigrants | Venezuela | 83.6 /100 | #143 | Excellent 15.7% |
| Canadians | 83.3 /100 | #144 | Excellent 15.7% |
| South Americans | 81.3 /100 | #145 | Excellent 15.6% |
| Immigrants | Afghanistan | 79.4 /100 | #146 | Good 15.6% |
| Hungarians | 79.1 /100 | #147 | Good 15.6% |
| Immigrants | Senegal | 78.2 /100 | #148 | Good 15.5% |
Demographics Similar to Immigrants from Ukraine by Master's Degree
In terms of master's degree, the demographic groups most similar to Immigrants from Ukraine are Laotian (17.0%, a difference of 0.060%), Immigrants from England (17.0%, a difference of 0.10%), Immigrants from Northern Africa (17.1%, a difference of 0.26%), Albanian (17.0%, a difference of 0.27%), and Immigrants from Morocco (17.1%, a difference of 0.29%).
| Demographics | Rating | Rank | Master's Degree |
| Romanians | 99.1 /100 | #91 | Exceptional 17.2% |
| Immigrants | North America | 99.1 /100 | #92 | Exceptional 17.2% |
| Immigrants | Italy | 99.1 /100 | #93 | Exceptional 17.2% |
| Ugandans | 99.0 /100 | #94 | Exceptional 17.1% |
| Immigrants | Morocco | 98.9 /100 | #95 | Exceptional 17.1% |
| Immigrants | Northern Africa | 98.9 /100 | #96 | Exceptional 17.1% |
| Immigrants | England | 98.8 /100 | #97 | Exceptional 17.0% |
| Immigrants | Ukraine | 98.8 /100 | #98 | Exceptional 17.0% |
| Laotians | 98.8 /100 | #99 | Exceptional 17.0% |
| Albanians | 98.7 /100 | #100 | Exceptional 17.0% |
| Immigrants | Nepal | 98.6 /100 | #101 | Exceptional 17.0% |
| Chileans | 98.6 /100 | #102 | Exceptional 16.9% |
| Alsatians | 98.4 /100 | #103 | Exceptional 16.9% |
| Ukrainians | 98.3 /100 | #104 | Exceptional 16.9% |
| Syrians | 98.3 /100 | #105 | Exceptional 16.8% |